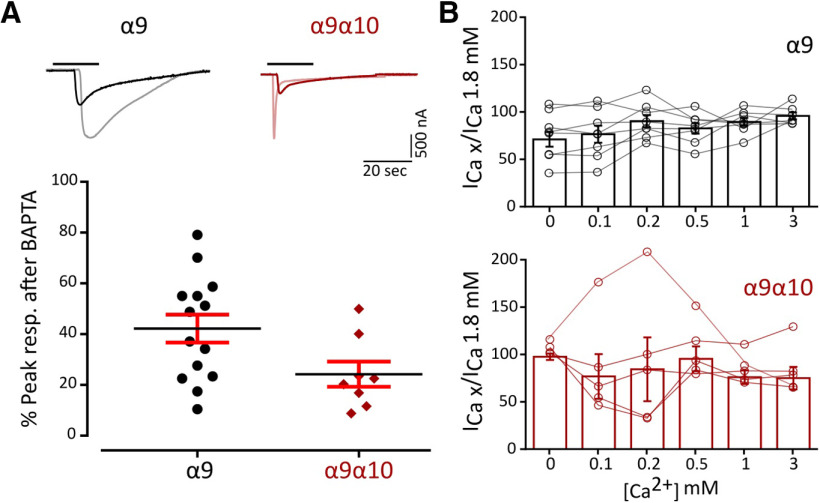
Figure 3.
Zebrafish α9 and α9α10 nAChRs have a high Ca2+ contribution to the total inward current and are not modulated by extracellular Ca2+. A, Top, Representative responses to a near EC50 concentration of ACh (α9, 10 μm; α9α10, 300 μm) in oocytes expressing zebrafish α9 and α9α10 nAChRs before (light colors) and after (solid colors) a 3 h incubation with BAPTA-AM. Bottom, Percentage of the initial peak response remaining after BAPTA-AM incubation. Lines indicate the median and IQR. Symbols represent individual oocytes (n = 14 and 8, respectively), B, ACh response amplitude as a function of extracellular Ca2+ concentration (top, α9; bottom, α9α10). ACh was applied at a near EC50 concentration (α9, 10 μm; α9α10, 300 μm). Current amplitudes recorded at different Ca2+ concentrations in each oocyte were normalized to the response obtained at 1.8 mm Ca2+ in the same oocyte (α9, gray circles; α9α10, pink circles). Vhold, −90 mV. Bars represent mean ± SEM (α9, black bars, n = 8; α9α10, red bars, n = 5).

