Figure 6.
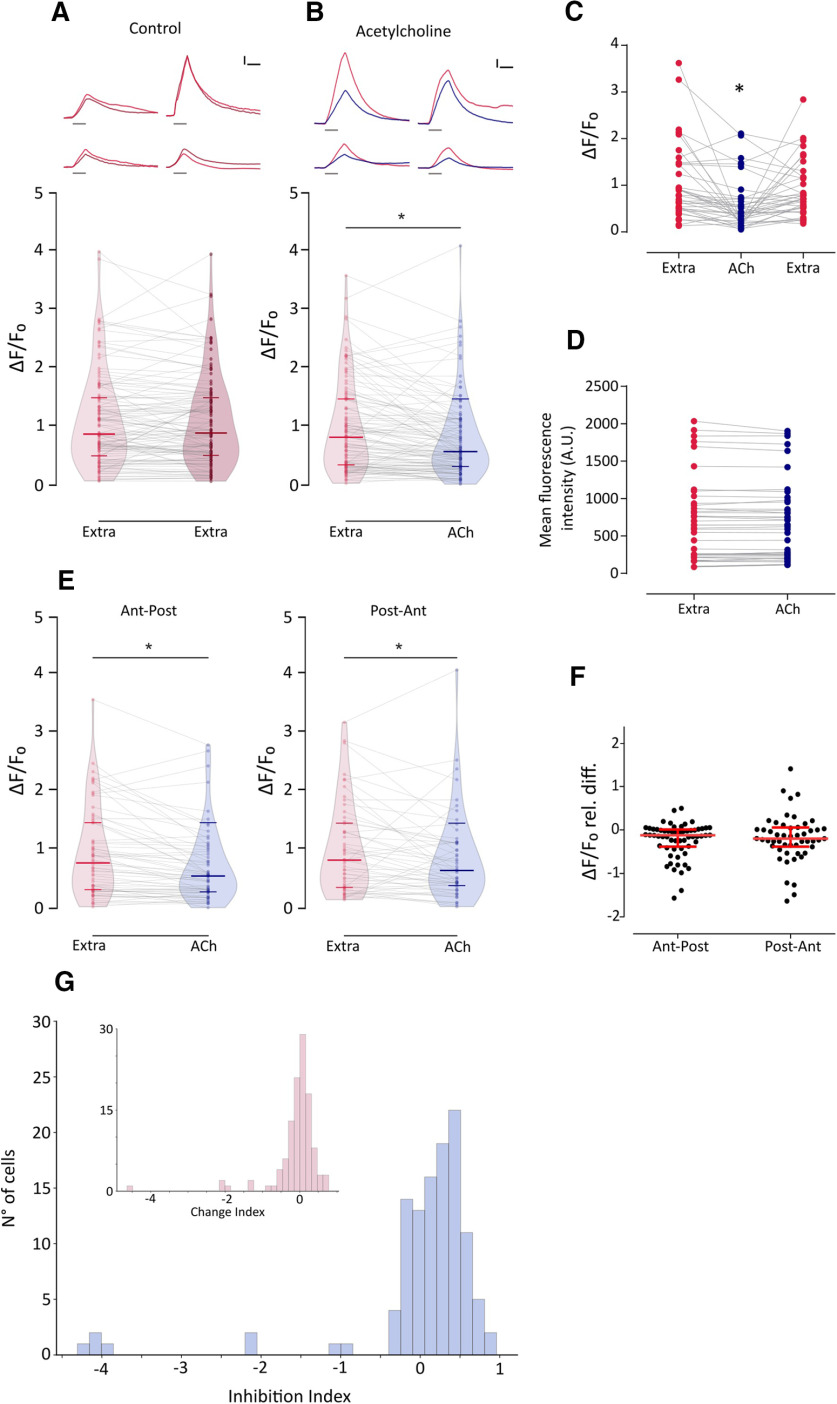
ACh inhibits mechanically evoked Ca2+ signals, and this inhibition is heterogeneous and independent of HC polarity A, Top, Representative temporal ΔF/F0 curves of mechanosensitive Ca2+ responses of four HCs over two trials with the same stimulation 1 min apart (1° stimulus, light red; 2° stimulus, dark red). Curves are aligned to the onset of the mechanical stimulus. Bottom, Peak ΔF/F0 for single HCs (n = 113) over two trials with the same stimulation after 1 min. B, Top, Representative temporal ΔF/F0 curves of mechanosensitive Ca2+ responses of four HCs before (red) and after (blue) the application of 1 mm ACh. Curves are aligned to the onset of the mechanical stimulus. Bottom, ACh application reduces mechanosensitive Ca2+ responses (n = 114, W = −3493, *p = 7.89e-07, MPRBC = 0.532, Wilcoxon matched-pairs signed-rank test). C, ACh-mediated reduction in mechanically evoked Ca2+ signals is reversed after a 1 min wash with extracellular imaging solution (n = 37; Friedman test: F = 18.54, p = 9.418e-05; Dunn's multiple comparisons test: Extra vs ACh, *p = 0.000705; Extra vs Wash, p = 0.608054). D, Basal Ca2+ levels show no significant differences before and during the application of 1 mm ACh (n = 45 cells, t = 0.7816, df = 44, p = 0.4386, two-tailed paired t test). E, ACh reduces mechanosensitive Ca2+ responses in HCs of opposing polarity (Ant-Post: n = 62, W = −1227, *p = 1.698e-05, MPRBC = 0.628; Post-Ant: n = 52, W = −582, *p = 0.008, MPRBC = 0.422; Wilcoxon matched-pairs signed-rank test). F, HCs of opposing polarity exhibit no significant differences between their ACh-mediated relative change in peak ΔF/F0 (U = 1560, p = 0.7687, Mann–Whitney test). G, Distribution of II calculated as (ΔF/F0extra – ΔF/F0ACh)/ΔF/F0extra) for ACh-treated HC. Inset, Distribution of change index [calculated as (ΔF/F0stim1 – ΔF/F0stim2)/ΔF/F0stim1] for two successive mechanical stimuli under control conditions. The distribution of the change index is centered around 0. A reduced number of cells (<10%) exhibit large negative change index values that occur when the fluorescence signal is greater during the 2° stimulus, suggesting that these might be outliers. Lines inside violin plots in A, B and E indicate the median and IQR. Calibration: A, B, 1.5 s; A, B, 25% ΔF/F0. Duration of the stimulus in A and B, top, is indicated by gray lines below each trace.

