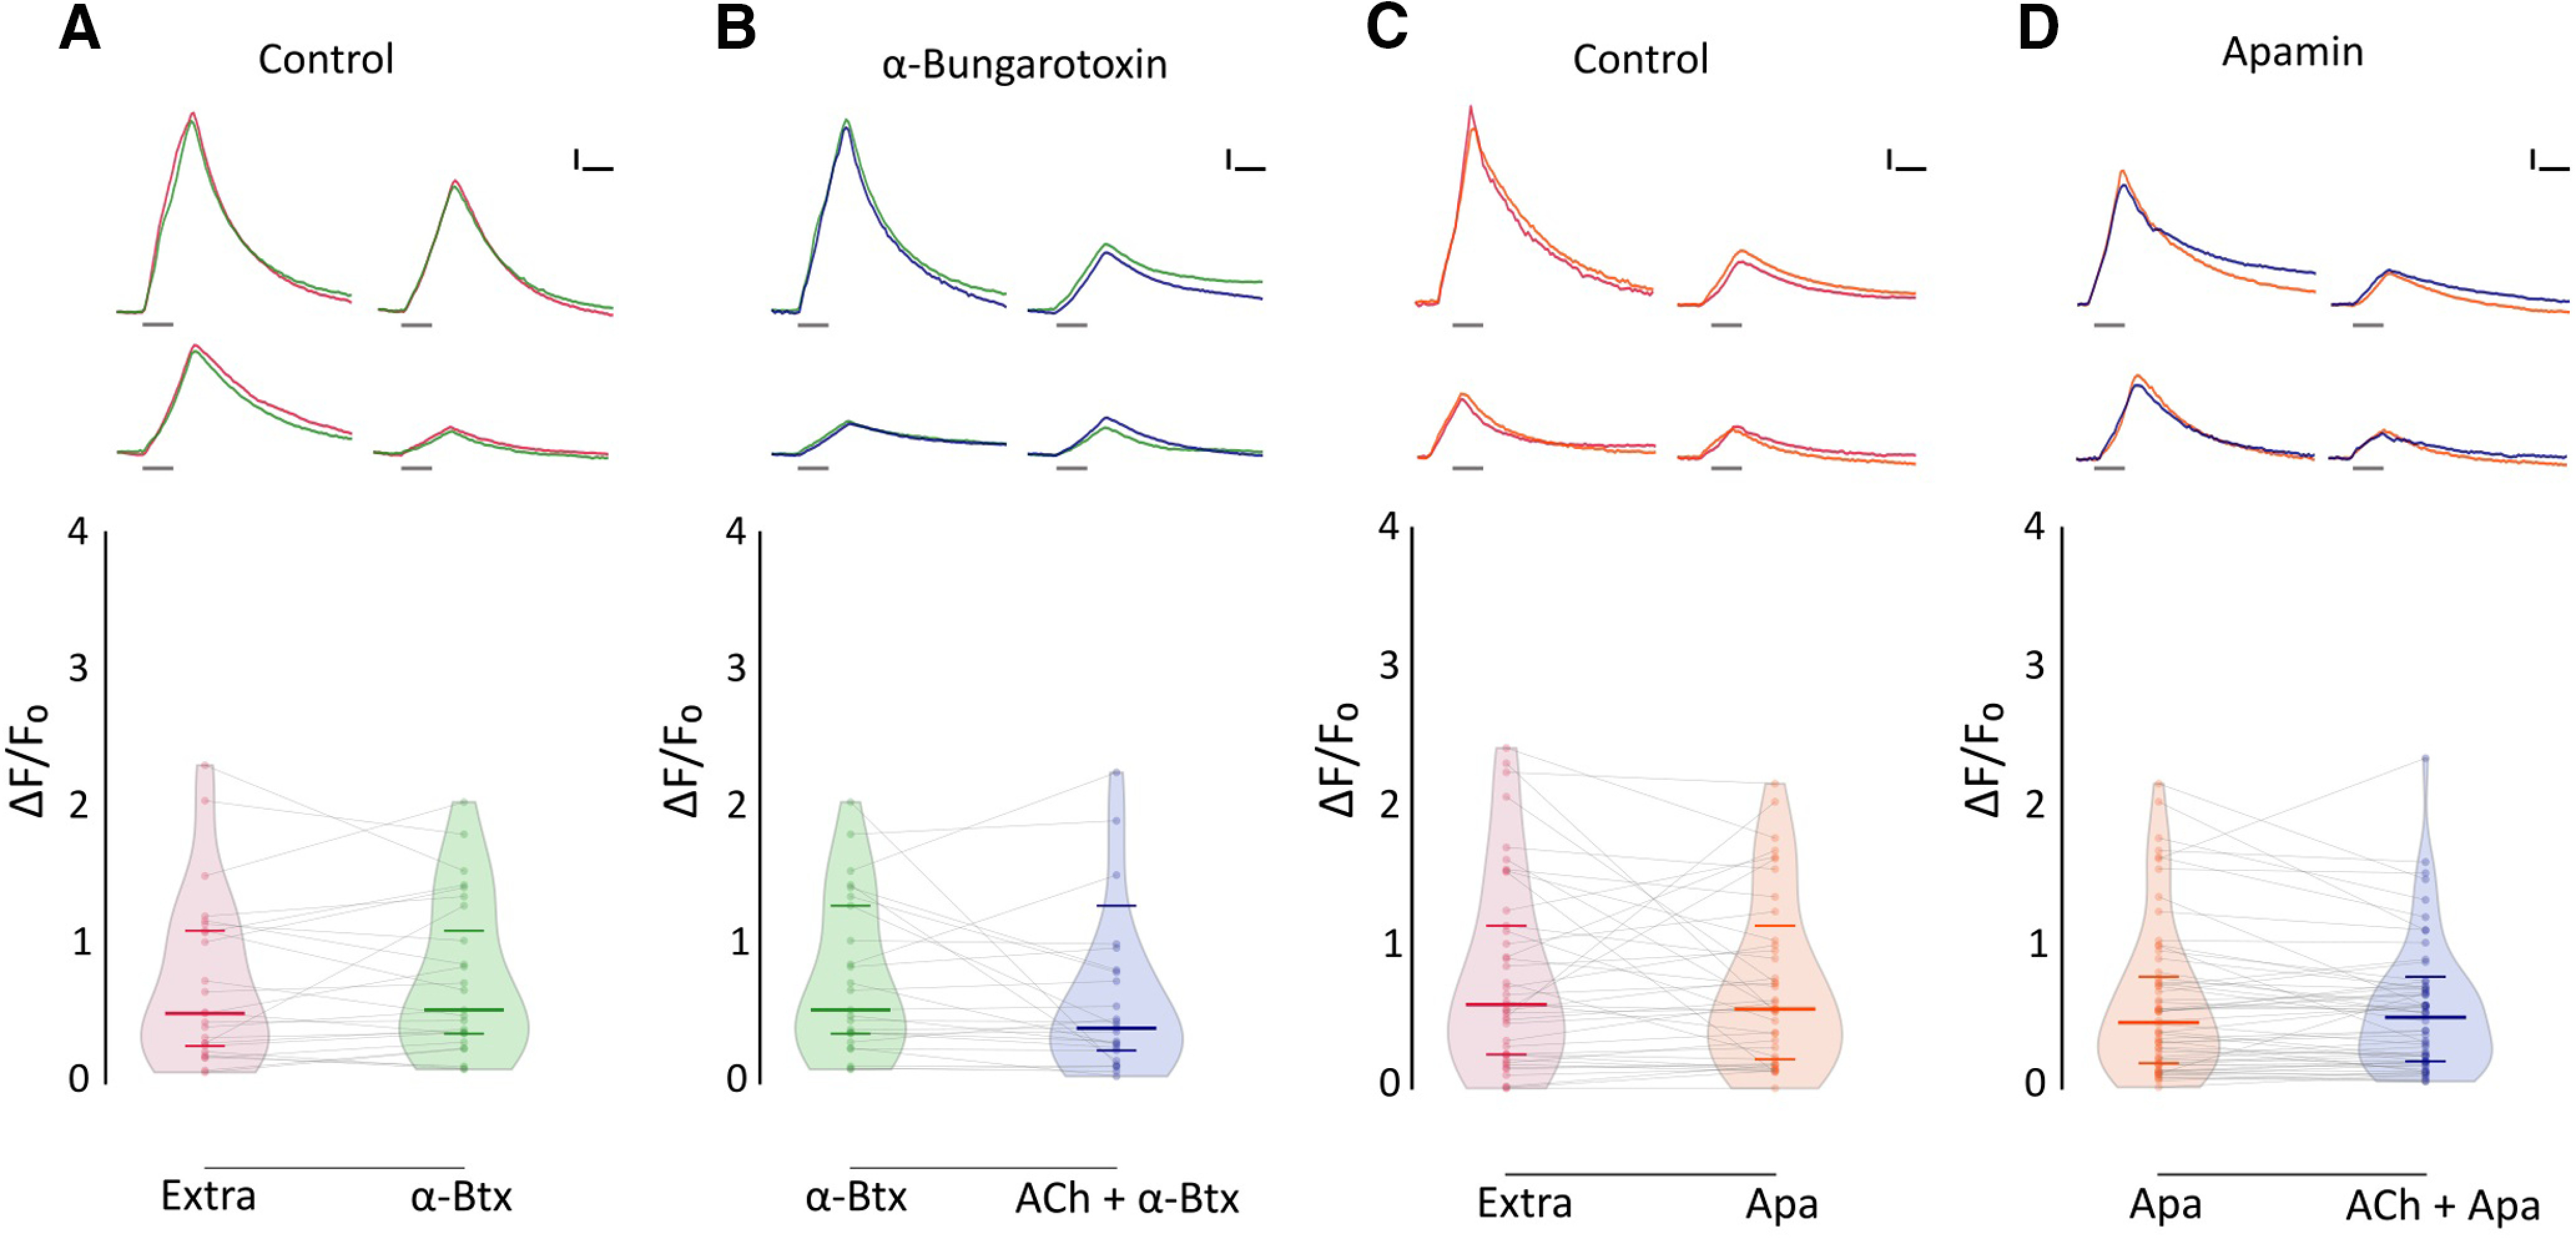
Figure 7.

ACh-mediated inhibition of evoked Ca2+ signals is blocked by α-Btx and apamin. A, Top, Representative temporal ΔF/F0 curves of mechanosensitive Ca2+ responses of four HCs, before (red) and after (green) the application of 10 μm α-Btx. Bottom, Mechanosensitive Ca2+ signals show no significant difference before and after 10 μm α-Btx treatment (Extra: median ΔF/F0 = 0.509; IQR, 0.252–1.134; vs α-Btx: median ΔF/F0 = 0.534; IQR, 0.331–1.325; n = 25, W = −45, p = 0.5449, MPRBC = 0.138). B, Top, Representative temporal ΔF/F0 curves of mechanosensitive Ca2+ responses of four HCs, after the application of 10 μm α-Btx (green) and after the coapplication of 1 mm ACh and 10 μm α-Btx (blue). Bottom, When coapplied with 10 μm α-Btx, ACh-mediated inhibition is blocked (n = 25, W = −87, p = 0.2521, MPRBC = 0.268). C, Top, Representative temporal ΔF/F0 curves of mechanosensitive Ca2+ responses of four hair cells, before (red) and after (orange) the application of 10 μm apamin. Bottom, Mechanosensitive Ca2+ signals show no significant difference before and after 10 μm apamin treatment (Extra: median ΔF/F0 = 0.599; IQR, 0.243–1.216; versus Apa: median ΔF/F0 = 0.567; IQR, 0.191–1.040; n = 41, W = −91, p = 0.5554, MPRBC = 0.106). D, Top, Representative temporal ΔF/F0 curves of mechanosensitive Ca2+ responses of four HCs, after the application of 10 μm apamin (orange) and after the coapplication of 1 mm ACh and 10 μm apamin (blue). Bottom, ACh-mediated inhibition is blocked by 10 μm apamin (n = 60, W = −322, p = 0.2359, MPRBC = 0.1759). A Wilcoxon matched-pairs signed-rank test was used in all cases. Calibration: A–D, 1.5 s; A–D, 25% ΔF/F0. Curves in A–D are aligned to the onset of the mechanical stimulus. The duration of the stimulus is indicated by gray lines below each trace.
