图 3.
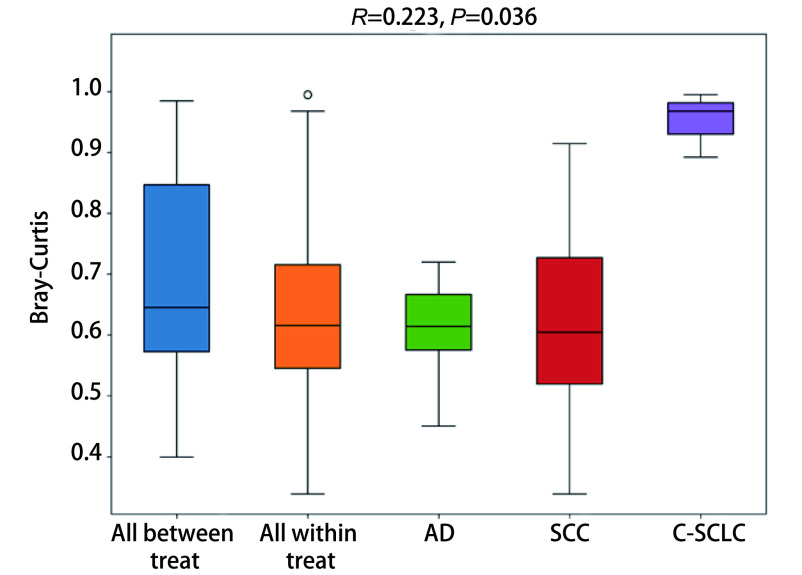
置换多元方差分析箱形图。Anosim分析得到的R值介于-1到1之间,越接近1表示组间差异越大于组内差异,R > 0提示组间差异显著,P < 0.05时说明检验的可信度高。纵坐表示Bray-Curtis距离;“All between treat”上方箱图代表所有组间样品Bray-Curtis距离数据,“All within treat”上方箱图代表所有组内样品Bray-Curtis距离数据,后面的箱型图分别是不同分组的组内样品间的Beta距离数据。SCLC因数据量少未纳入计算。
Anosim analysis box plot. The R value obtained by Anosim analysis was between -1 and 1. The closer to 1, the difference between groups was greater than that within groups. When P value is less than 0.05, the reliability of the test is high. Longitudinal seating represents the Bray-Curtis distance. The box diagram above "All Between Treat" represents the Bray-Curtis distance data of all between-treat samples. The box diagram above "All within Treat" represents the Bray-Curtis distance data of all within-treat samples. The box diagram behind represents the Beta distance data of samples in different groups. SCLC was not included in the calculation due to the small amount of data.

