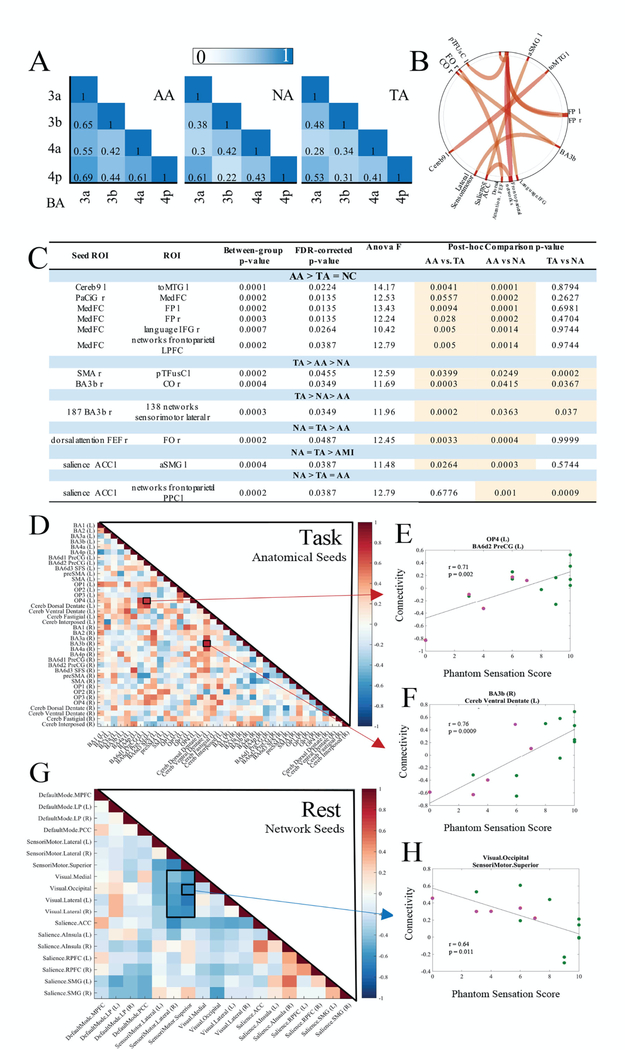
Fig. 3. Functional Sensorimotor Connectivity.
(A) Sensorimotor functional connectivity of the BA 3a, 3b, 4a, and 4p regions within the ankle ROI is represented by averaged Pearson’s correlation coefficients. (B) ROI-to-ROI functional connectivity across all groups. (C) Table of ROI-to-ROI functional connectivities of significance (pFDR < 0.05, two-tailed). Post hoc ANOVA analyses presented in the table demonstrate the relative strength of each relationship between groups. Significant comparisons are highlighted in orange. (D) Anatomical seed-based cross-ROI correlation to phantom sensation score during task. (E,F) The two highest positively (P < 0.002, P < 0.0009) correlated relationships (OP4/BA6d2 PreCG and BA3b/Cereb ventral dentate) are plotted to demonstrate the distribution of data on a per-individual basis (AA, green, n = 10 and TA, orange, n = 5). (G) Network seed-based cross-ROI correlation to phantom sensation score during resting state. (H) The strongest negatively correlated relationship (P < 0.011) from resting state (visual.occipital/sensorimotor.superior) is plotted to demonstrate the distribution of data on a per-individual basis (AA, green, n = 10 and TA, orange, n = 5).

