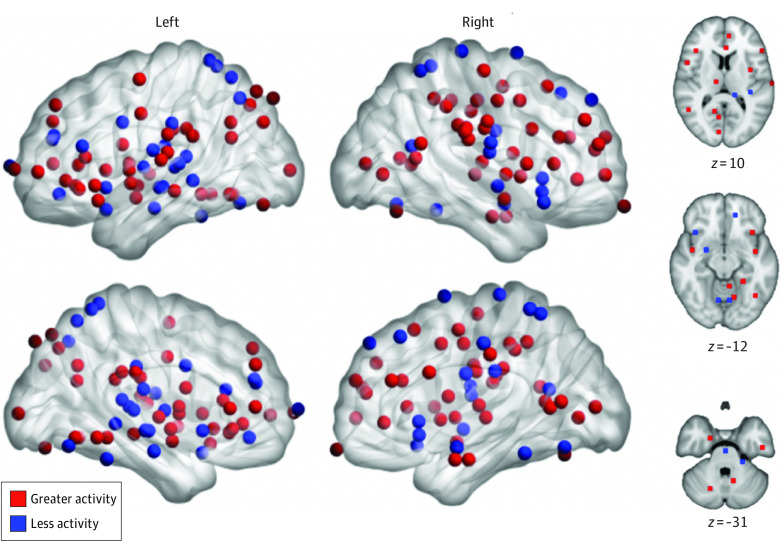
Figure 2. Distribution of Foci From Experiments Reporting Differences in Responses to Experimentally Induced Pain Between Patients With Chronic Pain and Healthy Controls.
Peak coordinates of clusters where activation was reported to be different between patients and controls had a broad spatial distribution. Red foci represent coordinates in experiments reporting greater pain responses in patients, whereas blue foci denote locations in experiments reporting reduced pain responses in patients.

