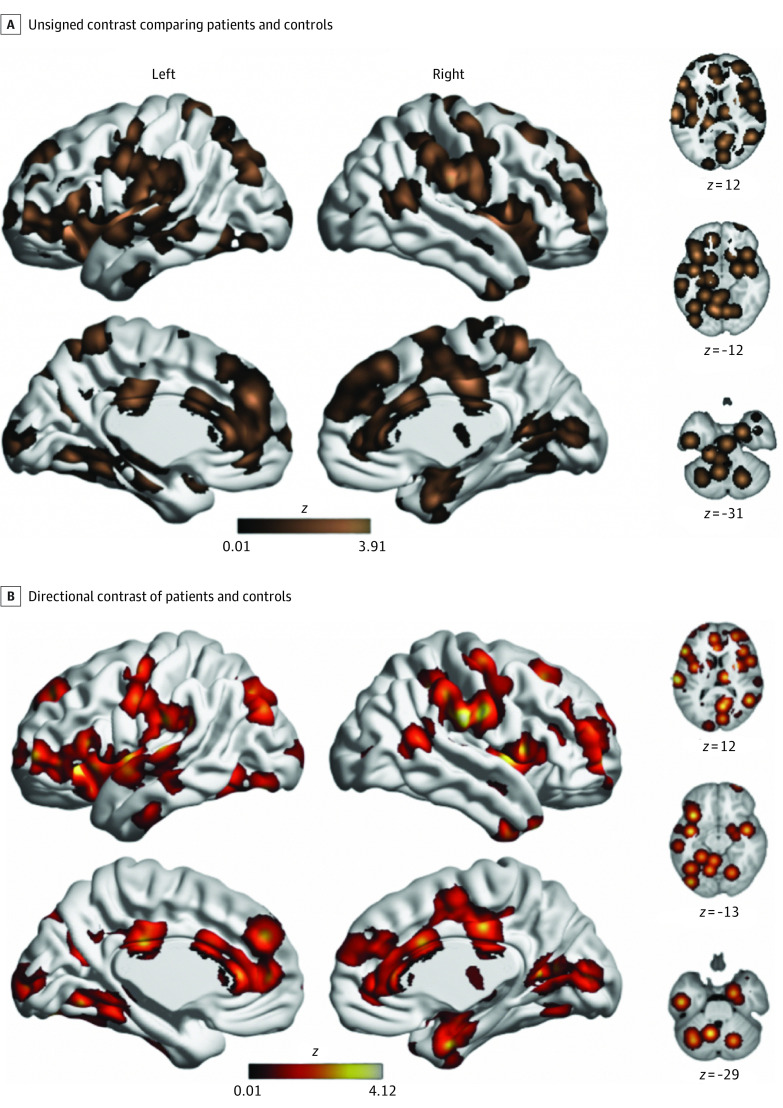
Figure 3. Unthresholded Maps of Differences Between Patients With Chronic Pain and Healthy Controls.
Maps display unthresholded associations from analyses. No between-group differences were significant at our preregistered statistical threshold (voxel height, P < .001; familywise error–corrected cluster significance, P < .05). However, pain-related regions appeared to be enriched for (nonsignificant) associations, which motivated post hoc regional analyses.

