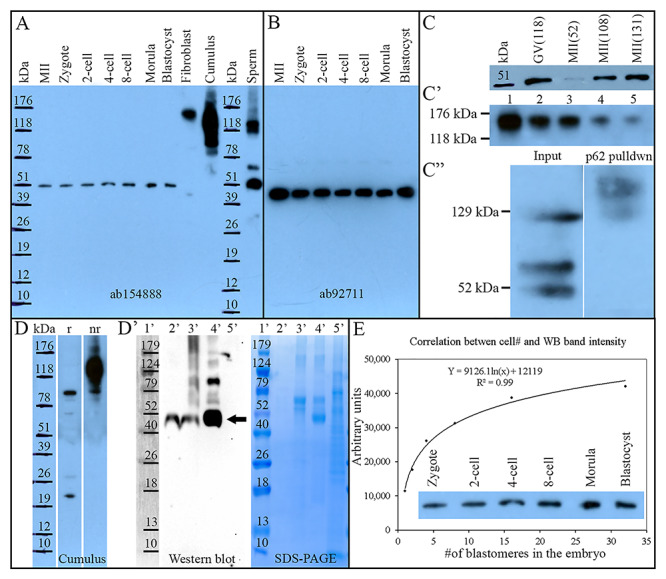
Figure 2.

Proteomic characterization of NEDL2 in the porcine oocytes, preimplantation embryos, ejaculated spermatozoa, and somatic cells. (A) Western blot analysis of NEDL2 in porcine ova, embryos (30 per lane), somatic cells (fibroblast and cumulus cells), and spermatozoa, probed with rabbit polyclonal anti-NEDL2 antibody (ab154888, Abcam; the same antibody was used in C, D, and E). A single unique band at 52 kDa was detected in oocytes and embryos. Both somatic controls displayed multiple high mass bands; cumulus cells at 91 and 136 kDa (this band disappears under reducing conditions, see D), and fibroblast cells at 155 kDa. Ejaculated sperm extracts prominently displayed the same 52 kDa band and two other bands at 74 and 129 kDa. (B) Western blot analysis of NEDL2 in porcine ova and embryos (30 per lane) by using a different rabbit polyclonal anti-NEDL2 antibody (ab92711, Abcam). A single band in these tissue samples confirmed the observation in (A). (C) Repeated WB of NEDL2 by using different oocyte samples (52 kDa), (C’) series dilution of fibroblast cell lysate (Lane 1, undiluted; Lanes 2 to 5: 1:1, 1:3, 1:7, and 1:15 dilution in loading buffer), and (C”) NEDL2 detection in polyubiquitinated protein fraction, affinity-purified from ejaculated sperm sample including input control. (D) NEDL2 detection in cumulus cell under reducing (r) and non-reducing (nr) SDS-PAGE conditions, (D’) WB analysis of NEDL2 IP from 500 metaphase-II-arrested ova with SDS-PAGE gel run in parallel. Lane 1′: molecular mass standards (Marker); Lane 2′: IP with cross-linked antibody, epitope eluted with low pH; Lane 3′: SDS loading buffer eluted epitope followed after the low pH elution; Lane 4′: conventional IP, epitope eluted with SDS loading buffer; Lane 5′: antibody non-binding/flow-through fraction. The 52 kDa band of expected gametic NEDL2 is labeled with an arrow. (E) Correlation between cell number in developing embryos and NEDL2 abundancy detected by WB and densitometric quantification (r = 0.99, P < 0.01).
