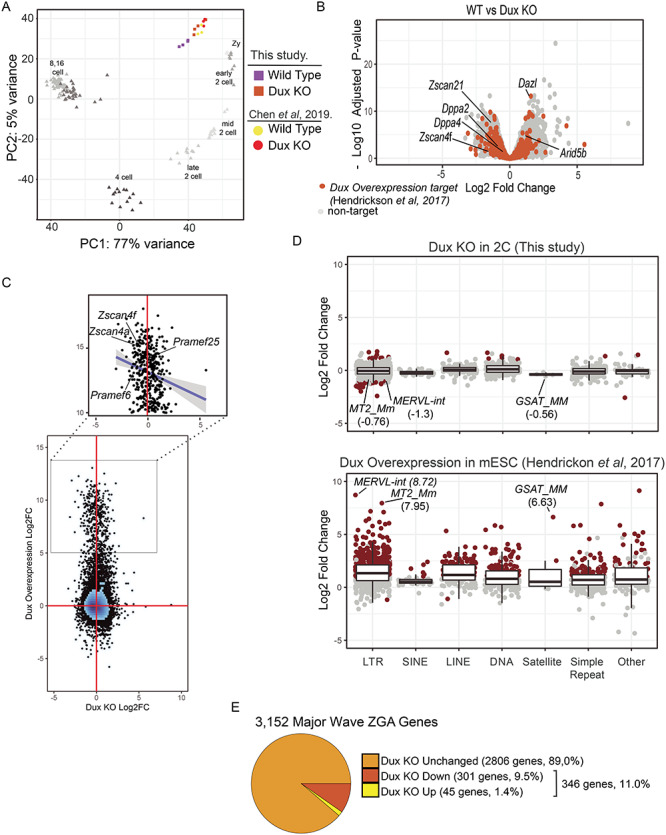
Figure 4.

Gene expression changes at the 2-cell stage in Dux KO embryos. A. Principal component analysis of WT (purple) and Dux KO (orange) gene expression profiles at the 2-cell stage. Prior data from the 2-cell stage is shown for WT (yellow) and Dux KO (red) [18]. The principal components were calculated by including developmental time course from zygotes to the 16 cell stage using data from [22]. Principal component 1 captures 77% of the variance across samples reflecting the developmental stage. B. Gene expression changes between WT and Dux KO embryos. The x-axis corresponds to the log2Fold change and the y-axis corresponds to the negative log10 of the Benjamini–Hockberg corrected P-value. Orange points represent genes upregulated >2-fold in Dux overexpression experiments in ESCs [2]. C. Comparison of gene expression between Dux KO in 2-cell stage embryos to Dux overexpression in ESCs. Figure 4. (continued) The x- and y-axis correspond to the log2 fold change in expression for overexpression and KO experiments, respectively. The zoomed region corresponds to genes that are upregulated by more than 32-fold in the overexpression experiment. The trend line represents a linear fit to this subset. D. Expression changes were estimated for Dux KO (upper panel) and Dux overexpression experiments in ESCs (lower panel) [2] and grouped together by repeat class. Points correspond to repeat families and are colored red to indicate statistically significant expression changes (log2 fold change > 1 or < −1, Benjamini–Hochberg adjusted P-value < 0.05 and mean counts > 25). E. Proportions of major wave ZGA genes that are upregulated at the 2-cell stage in the Dux KO. Major wave ZGA genes were defined as genes expressed more highly at mid-2 cell stage relative to zygotic embryos in the data from [22].
