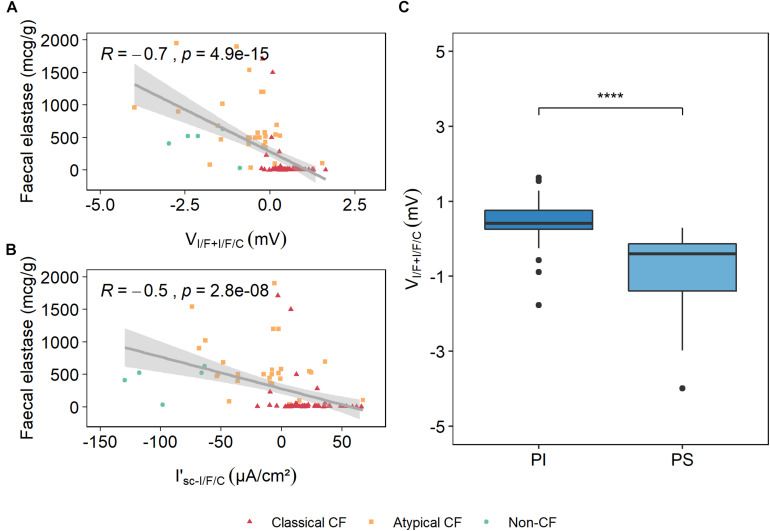
FIGURE 4.
Correlation of fecal elastase E1 (FE-1) values and VI/F+I/F/C and I’sc–I/F/C. Spearman rho rank correlation analysis showed that there is a strong negative correlation between FE-1 and VI/F+I/F/C, with a correlation coefficient of ∼0.7 (A), whereas FE-1 correlation with I’sc–I/F/C is moderate, with a coefficient of ∼0.5. (B) R represents the correlation coefficient and p represents the p value. (C) The values from the voltage of the maximal activation of CFTR measured in the I’sc–I/F/C responses were plotted and grouped by the exocrine pancreatic function (PI and PS), and show that PwCF who are PI are associated with higher VI/F+I/F/C values and that PS PwCF are associated with lower VI/F+I/F/C values. [Kruskal–Wallis rank sum test (****p ≤ 0.0001)].

