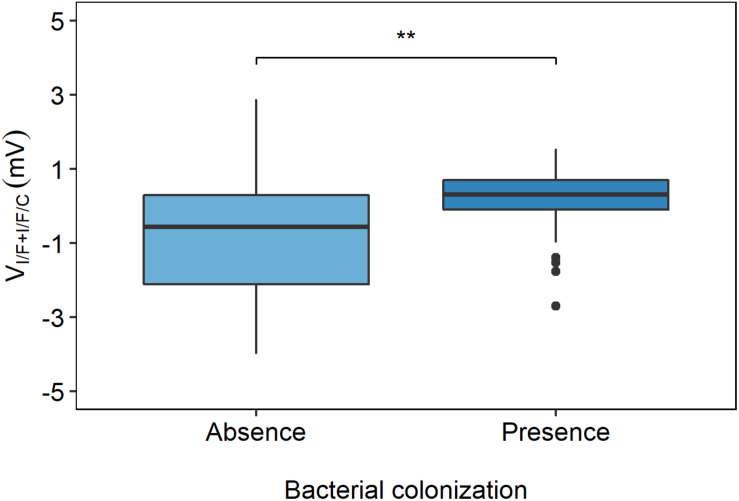
FIGURE 7.
Distribution of VI/F+I/F/C values in individuals with and without bacterial colonization. The VI/F+I/F/C values were plotted and grouped by the absence or presence of bacterial colonization, and show that less bacterial colonization occurs in PwCF with lower VI/F+I/F/C values and that higher frequency of bacterial colonization occurs in PwCF with higher VI/F+I/F/C values, [Kruskal–Wallis rank sum test (**p ≤ 0.01)].

