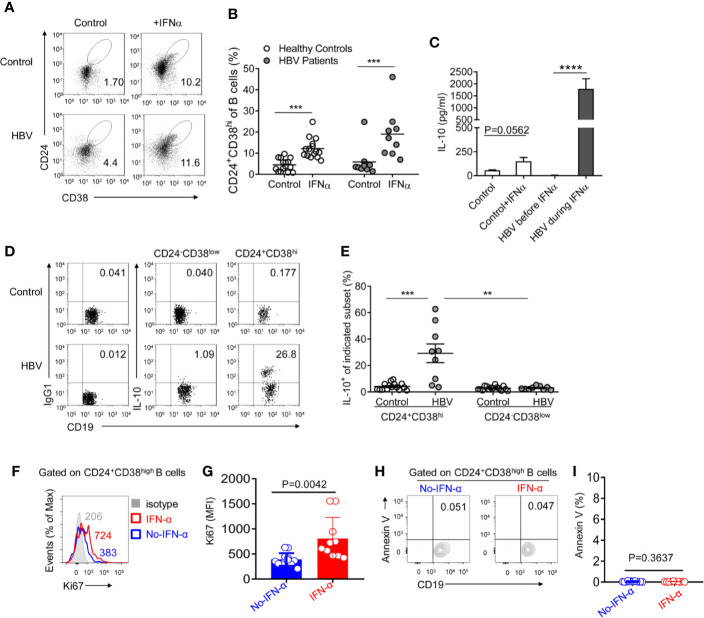
Figure 3.
CD24+CD38hi B cells are induced under Peg-IFNα-2b and produce plenty of IL-10. (A, B) PBMCs from HBV patients and healthy controls were cultured in complete RPMI medium 1640 with or without human Peg-IFNα-2b (100 ng/ml) for 36h. Representative density plots (A) and percentage analysis (B) showing CD24 and CD38 expression on gated B cells from HBV patients and healthy controls. n = 15 (healthy controls) and 9 (HBV patients). Paired t test. (C) ELISA analysis of IL-10 secretion in cell-free supernatants of cultured PBMCs from HBV patients before or during Peg-IFNα-2b therapy and healthy controls with or without re-stimulation by Peg-IFNα-2b (25 ng/ml) during a 32-h culture. PBMC from HBV patients were collected before PEG-IFNα-2b therapy or at 12-36 weeks after the start of Peg-IFNα-2b therapy. (D) Representative density plots and (E) percentage analysis of IL-10 expression on gated CD24+CD38hi B cells and CD24-CD38low mature B cells from HBV patients and healthy controls. These B cells were from freshly isolated PBMC in HBV patients and healthy controls. After 4 h of stimulation with PMA and ionomycin in the presence of monensin, intracellular flow cytometry staining was done and gated as CD19+CD3- cells. n = 15 (healthy controls) and 9 (HBV patients). Paired t-tests were used for the analysis in subsets from the same patient. Data are presented as Mean ± SEM, **P < 0·01, ***P < 0·005, ****P < 0·0001. (F) Flow cytometry analysis of Ki67 expression on the CD24+CD38high B cells from PBMC of HBV patients without (blue) or with (red) PEG-IFNα-2b therapy for 12-24 weeks. (G) Statistics calculated by the MFI of Ki67 from PBMC of HBV patients without (blue, n = 12) or with (red, n = 10) PEG-IFNα-2b therapy for 12-24 weeks. Unpaired t test. **P < 0.01; ***P < 0.001; ****P < 0.0001. Data are presented as mean ± SD. (H) Flow cytometry analysis of Annexin V expression on the CD24+CD38high B cells from PBMC of HBV patients without (blue) or with (red) PEG-IFNα-2b therapy for 12–24 weeks. (I) Statistics calculated by the percentage of Annexin V+ Breg cells from PBMC of HBV patients without (blue, n = 12) or with (red, n = 10) PEG-IFNα-2b therapy for 12–24 weeks. Unpaired t test. **P < 0.01; ***P < 0.001; ****P < 0.0001. Data are presented as mean ± SD.

