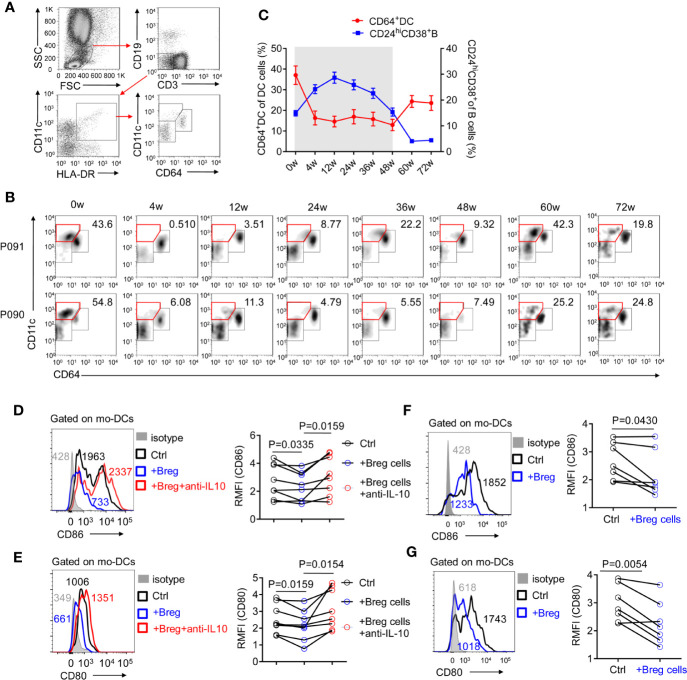
Figure 6.
CD24+ CD38hi B cells are negatively correlated with monocyte-derived DC cells. (A) Representative density plots of the gating strategy used for CD64+DC cells. (B) Representative density plots of CD11c and CD64 expressions on gated DC cells from HBV patients at each time point during PEG-IFNα-2b therapy. (C) Percentages analysis showing that CD24+CD38hi B cells are negatively correlated with CD64+DC cells. n = 47. Mean ± SEM. (D–G) Mo-DCs were cultured in 48-well flat-bottom plates at a density of 0.5-1.0 × 10⁵ cells per well in a complete RPMI medium 1640 (Gibco, Grand Island, NY, U.S.A.) with 10% fetal bovine serum (HyClone, Logan, UT, U.S.A.) plus streptomycin and penicillin. Equal number of Breg cells were then added to the culture wells, with or without 3 μg/ml of anti-IL-10 (biolegend; #501427) for 24 h. (D, E) Left: mo-DCs were co-cultured with Breg cells (blue) or with Breg cells and 3 μg/ml of anti-IL-10 (red), stained with CD86 (D) or CD80 (E), and analyzed by flow cytometry. Right: The relative mean fluorescence intensity (RMFI) of n = 8 patients are shown. ((F, G) Left: mo-DCs were co-cultured with Breg cells (blue) in transwell system, stained with CD86 (C) or CD80 (D), and analyzed by flow cytometry. Right: The relative mean fluorescence intensity (RMFI) of n = 7 patients are shown. Data were analyzed by two-way ANOVA (D, E), or two-tailed paired Student’s t-test (F, G). Data are presented as mean ± SD.

