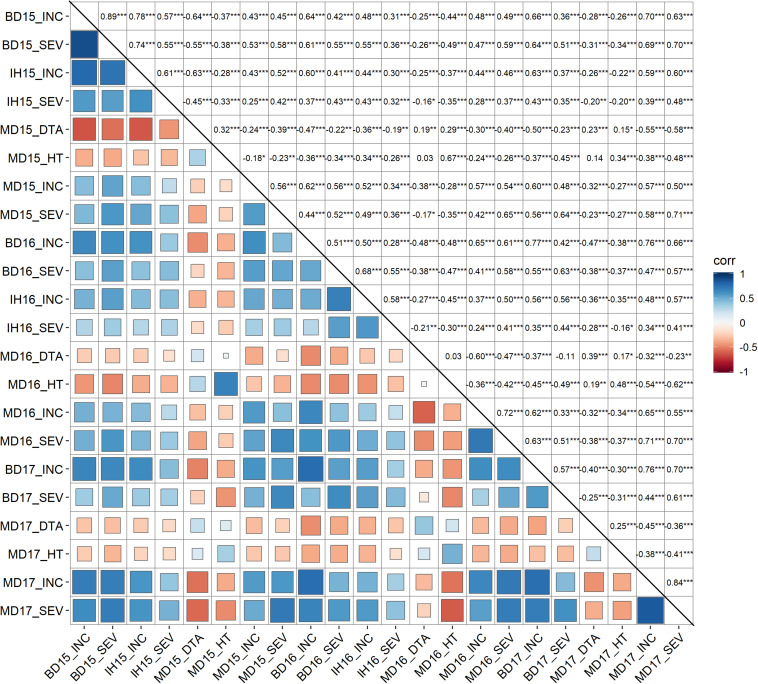
FIGURE 3.
Pearson correlation analysis of fusarium head blight resistance related traits. INC, Incidence (%), FHB incidence, percentage of spikes showing symptoms; SEV, severity (%), percentage of spike area infected; HT, plant height (cM); and DTA, day to anthesis. MD, Morden, MB; BD, Brandon, MB; IH, Indian Head, SK; 15, 16, and 17, field trials in year 2015, 2016 and 2017. Correlation coefficients were shown in upper triangle. Levels of significance claimed at *P < 0.05; **p < 0.005, ***p < 0.0001.

