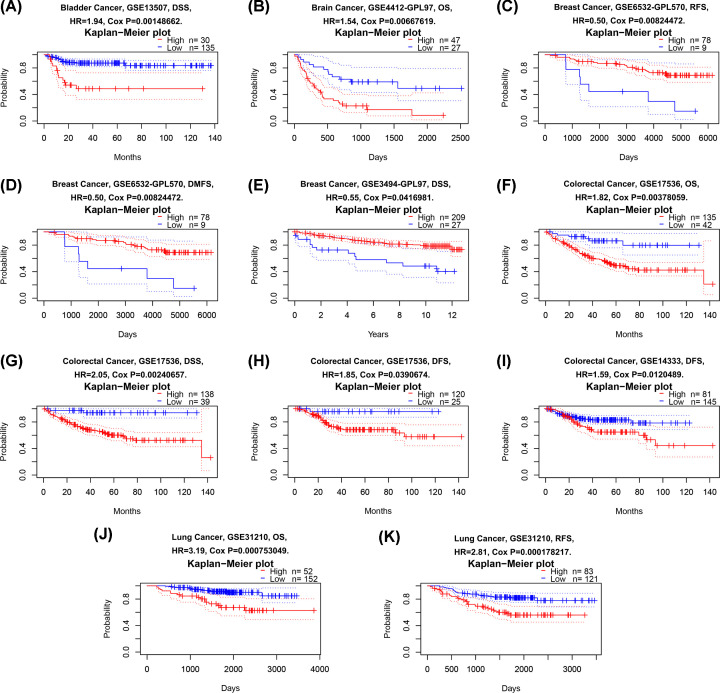
Figure 2. Kaplan–Meier survival curves comparing high and low expression of Fam20C in different cancer types in PrognoScan.
(A) DSS (n=165) in bladder cancer cohort GSE13507. (B) OS (n=74) in brain cancer cohort GSE4412-GPL97. (C,D) RFS (n=87) and DMFS (n=87) in BC cohort GSE6532-GPL570. (E) DSS (n=236) and in BC cohort GSE3494-GPL97. (F–H) OS (n=177), DSS (n=177) and DFS (n=145) in colorectal cancer cohort GSE17536. (I) DFS (n=226) in colorectal cancer cohort GSE14333. (J,K) OS (n=204) and RFS (n=204) in lung cancer cohort GSE31210.

