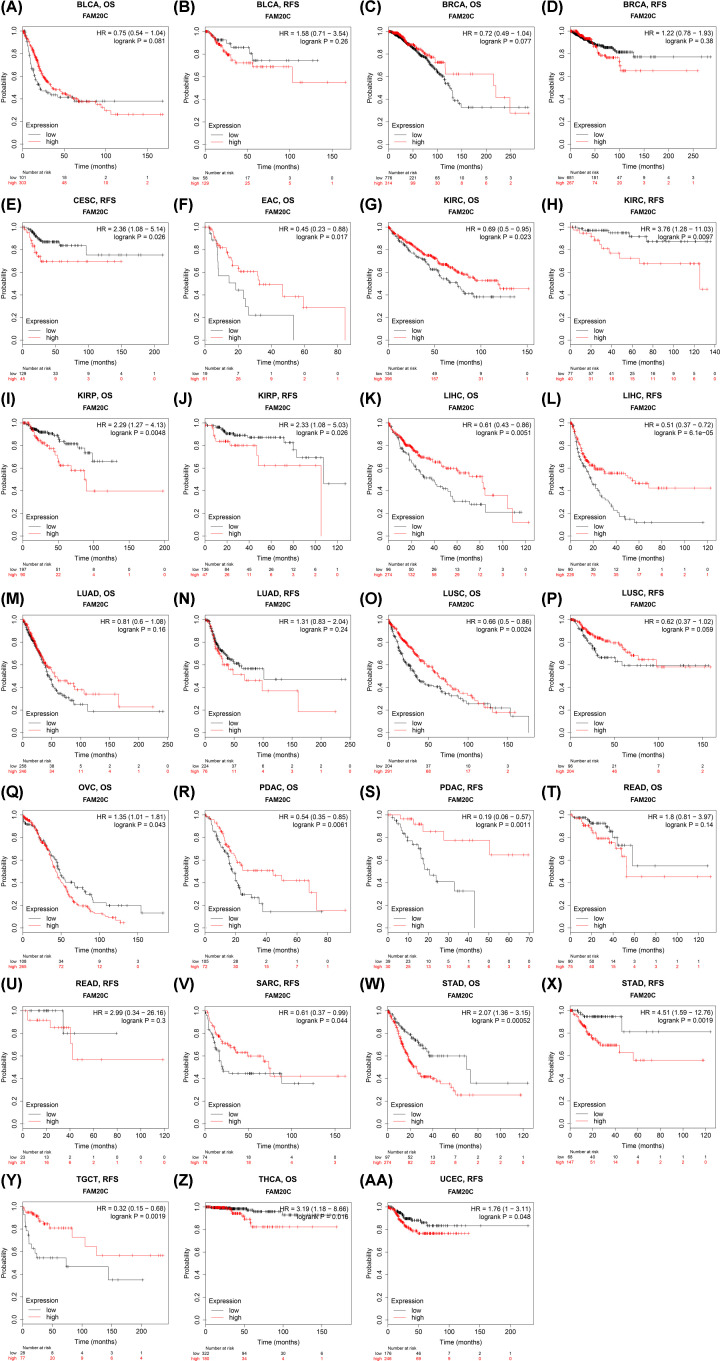
Figure 3. Kaplan–Meier survival curves comparing the high and low expression of Fam20C in different types of cancer in Kaplan–Meier Plotter.
(A,B) OS and RFS in BLCA. (C,D) OS and RFS in breast cancer (BRCA). (E) RFS in CESC. (F) OS in EAC. (G,H) OS and RFS in kidney renal clear cell carcinoma (KIRC). (I,J) OS and RFS in KIRP. (K,L) OS and RFS in LIHC. (M,N) OS and RFS in LUAD. (O,P) OS and RFS in lung squamous cell carcinoma (LUSC). (Q) OS in ovarian cancer (OVC). (R,S) OS and RFS in pancreatic ductal adenocarcinoma (PDAC). (T,U) OS and RFS in READ. (V) RFS in sarcoma (SARC). (W,X) OS and RFS in STAD. (Y) RFS in TGCT. (Z) OS in THCA. (AA) RFS in UCEC.

