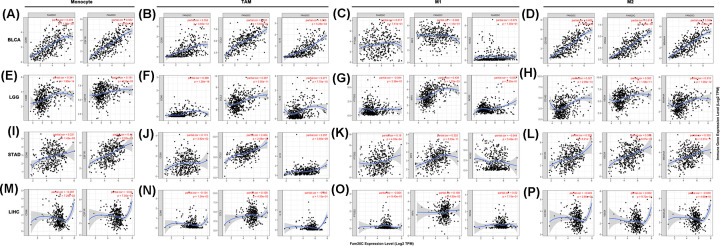
Figure 7. Fam20C expression correlated with macrophage polarization in BLCA, LGG, STAD, and LIHC.
Markers include CD86 and CSF1R of monocytes; CD80, CCL2, and IL10 of TAMs; PTGS2, IRF5, and NOS2 of M1 macrophages; and CD163, VSIG4, and MS4A4A of M2 macrophages. (A–D) Scatterplots of correlations between Fam20C expression and gene markers of monocytes (A), TAMs (B), M1 (C) and M2 macrophages (D) in BLCA (n=408). (E–H) Scatterplots of correlations between Fam20C expression and gene markers of monocytes (E), TAMs (F), M1 (G) and M2 macrophages (H) in LGG (n=516). (I–L) Scatterplots of correlations between Fam20C expression and gene markers of monocytes (I), TAMs (J), M1 (K) and M2 macrophages (L) in STAD (n=415). (M–P) The LISC was regarded as the control group showed that Fam20C expression has no significant correlation with macrophage polarization in LISC (n=371). The gene markers of monocytes (M), TAMs (N), M1 (O) and M2 macrophages (P).

