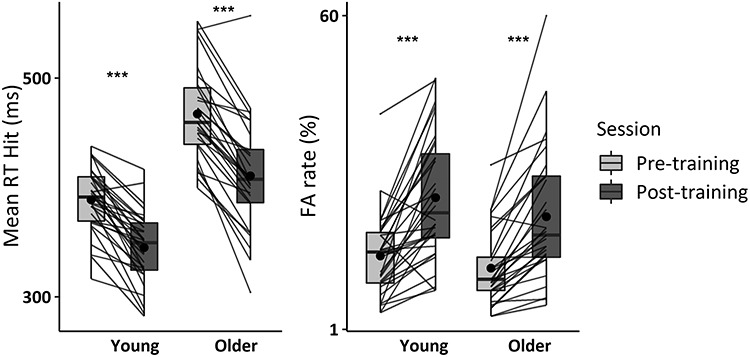
Figure 5.

Behavioral performance during the pre- and post-training Go/NoGo task. The response time on hit trials and the false alarm rate of the young and older adults with Go/NoGo training are represented. Individual data points, means (bold circle), medians, first and third quartiles (horizontal bars), and the 1.5 interquartiles range (whiskers) are represented. *P < 0.05, **P < 0.01, ***P < 0.001.
