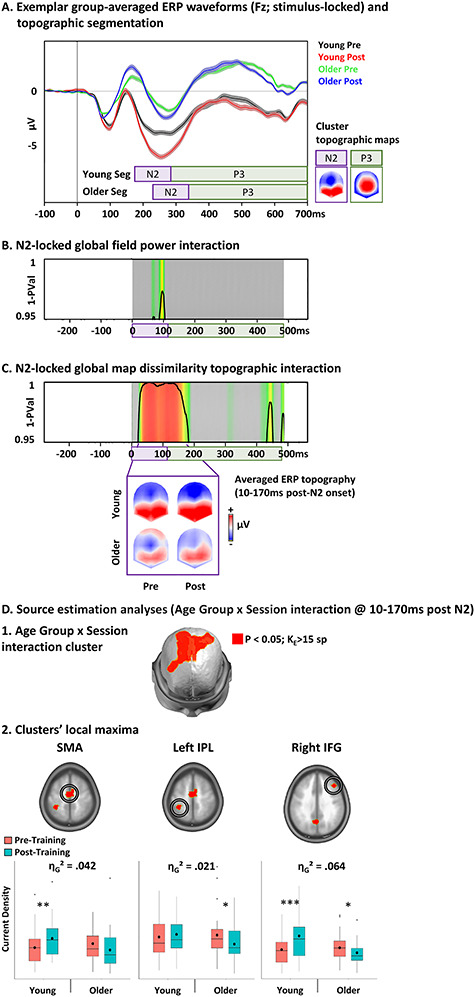
Figure 6.

Electrical neuroimaging results: Age by Session interaction. A. Exemplar group-average stimulus-locked ERPs for correct NoGo trials in the two age groups with Go/NoGo training for the pre- and post-training sessions. The template topographic maps of the temporal segmentation analysis used to define the periods of the N2 and P3 components are represented nasion upward. B and C. Results of the GFP (B) and of the GMD topographic (C) Age by session interaction revealed a sustained significant topographic but not GFP interaction during the N2 ERP component. The topographies of the ERP averaged over the period of the topographic modulation are represented nasion upward for the four experimental conditions. (D) Source estimation analyses over the period of interest defined in the analyses in the sensor space. The plots represent the means (bold circle), medians, first and third quartiles (horizontal bars), and minimal–maximal values (whiskers) of the current densities at the clusters’ local maxima (i.e., the solution points with the lowest P-value) showing the age by session interaction. SMA: supplementary motor area; IPL: inferior posterior lobe; IFG: inferior frontal gyrus; *P < 0.05, **P < 0.01, ***P < 0.001.
