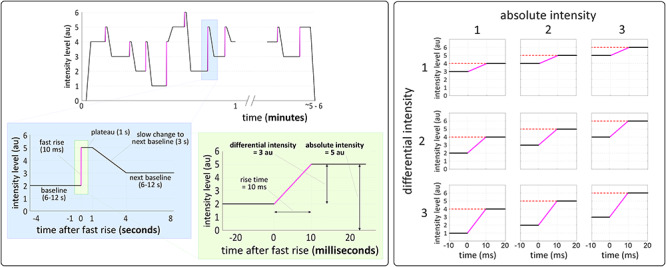
Figure 1.

Stimulation profile and experimental design. Left panel: stimulation profile of a typical block of all three experiments. Stimulus intensity abruptly increased from a baseline level to a target level in 10 ms, plateaued for 1 s and then slowly increased or decreased to the next baseline in 3 s. Right panel: differential and absolute intensity were modulated using a 3 × 3 factorial design. Each abrupt increase occurred between different baseline and target levels, thus yielding 9 conditions varying in their differential intensity (the difference between baseline and target) and absolute intensity (here defined as the target intensity reached by the increase).
