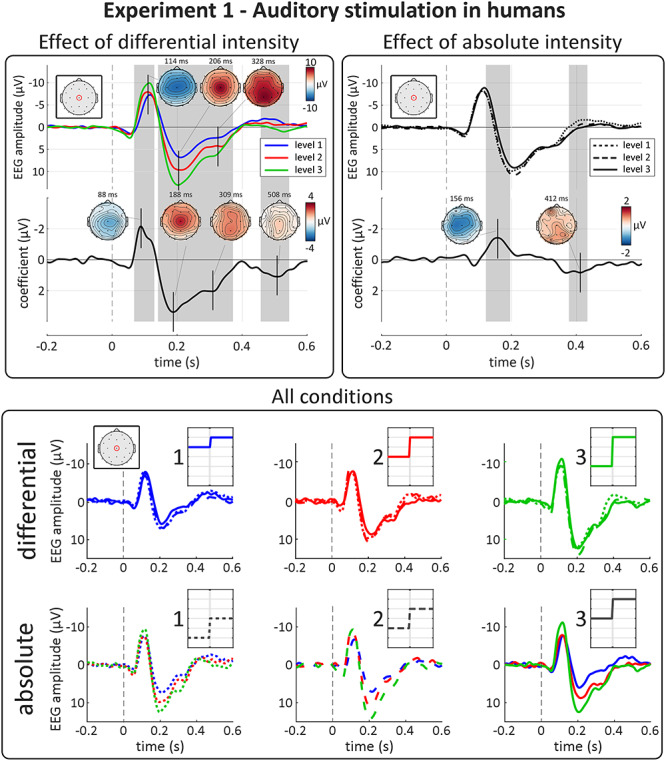
Figure 3.

Experiment 1: auditory-evoked VPs are highly sensitive to differential, not absolute, intensity. Top panels show the results of point-by-point LME analysis. Top plots show group-level average waveforms at Cz for each of the three levels of differential (left panel) and absolute intensity (right panel). Bottom plots show the LME model coefficient timecourse for each factor. Gray areas show significant clusters after permutation testing. Vertical dashed lines indicate stimulus onset. The amplitude of both negative and positive waves were strongly modulated by the factor “differential intensity.” The peak topographies of these effects correspond well to those of the EEG response. The apparent amplitude modulation at the inflection point of the VP by absolute intensity was consequent to a small latency shift (with higher absolute intensity resulting in longer-latency responses, see Results) rather than a modulation of magnitude per se. Bottom panel show group-level average waveforms at Cz, for each condition. Each row shows all 9 conditions of the experiment. Insets show schematic stimulus profiles, for each condition. Note the effect of differential, but not absolute intensity on both the negative and positive VPs.
