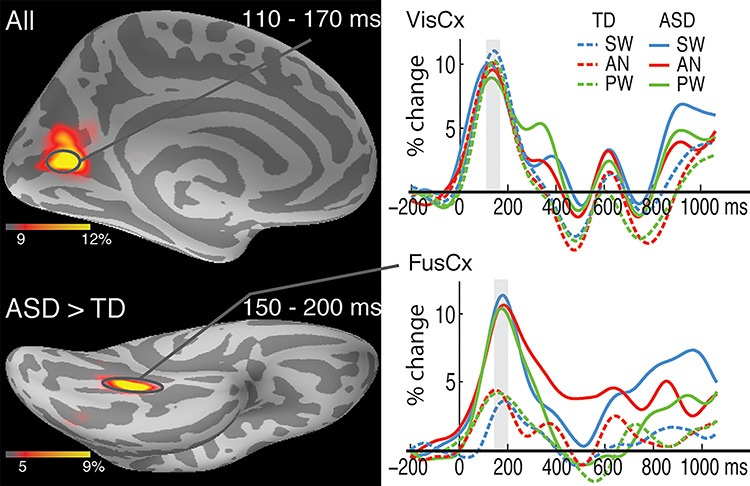
Figure 2.

Group average maps and time courses of event-related theta source power during 110–200 ms. The top panel shows similar overall theta activity in the left visual cortex (VisCx) across the ASD and TD groups. The bottom map (left) shows group differences in theta activity in the left fusiform cortex (FusCx). The associated time courses (bottom right) indicate greater theta for all three word conditions in the ASD compared to the TD group. The vertical light-shaded bars denote the time window used in the ROI statistical analysis.
