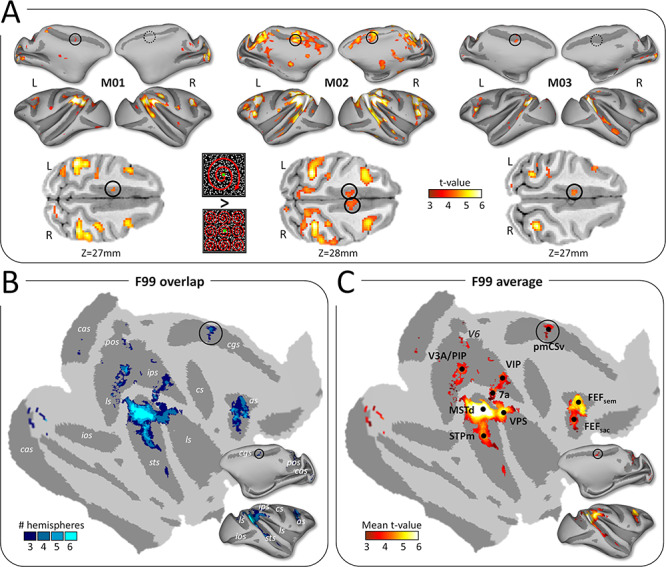
Figure 1.

Cortical activations for egomotion-consistent optic flow stimuli. (A) Illustration of the egomotion-consistent (EC) and inconsistent (EI) optic flow stimuli and t-value maps for the contrast EC > EI in monkeys M01, M02 and M03 (from Cottereau et al. 2017). Significant activations (t-value > 3.1, P < 0.001 uncorrected) are color-coded in red to white and projected onto medial and lateral views of the inflated left and right cortical surfaces of the individual monkeys. Putative monkey CSv (pmCSv) was found in 4/6 hemispheres (black circles) and the corresponding location is indicated in the other 2 hemispheres (dotted black circles). Activations of pmCSv in the left hemisphere of M01, M02, and M3 and in the right hemisphere of M02 are also shown on horizontal slices through the native volumetric space (black circles in the lower row of the panel). (B) Overlap of the activation maps across the 6 individual cortical surfaces. Individual maps were registered and projected onto flattened and inflated representations of the right cortical hemisphere of monkey F99 (see Methods section). Only activation sites found in at least 3/6 hemispheres are shown (cas: calcarine sulcus; pos: parieto-occipital sulcus; cis: cingulate sulcus; ips: intraparietal sulcus; ls: lateral sulcus; ios: inferior occipital sulcus; sts: superior temporal sulcus; cs: central sulcus; as: arcuate sulcus). (C) Average activations (mean t-value) across the sites that were significant in at least 3/6 hemispheres. Black dots indicate the local maxima of this group analysis (V3A/PIP, MSTd, STPm, VIP, 7a, FEFsem, FEFsac and pmCSv). See Supplementary Figure 4A for area V6 (marked with dark gray).
