
Figure 4.
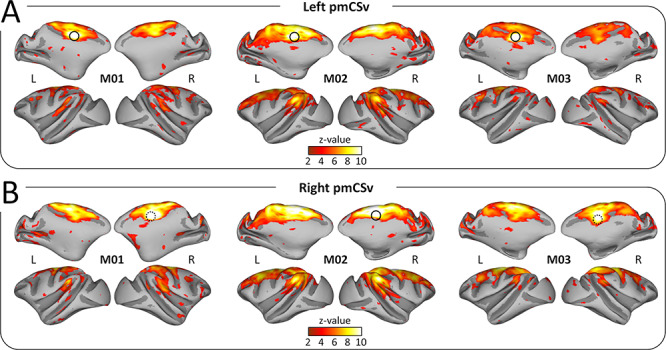
Functional connectivity: individual results. Whole-brain resting-state functional connectivity of the left pmCSv (A) and the right pmCSv (B). Individual z-value maps are projected onto medial and lateral views of the inflated left and right cortical surfaces for the 3 monkeys (threshold: z-value > 1.96).