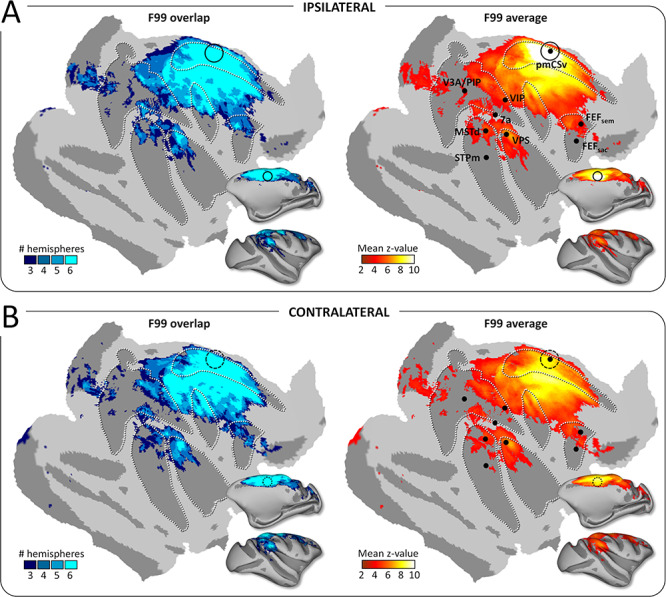
Figure 5.

Functional connectivity: group results. Whole-brain pmCSv resting-state functional connectivity. Cortical sites showing significant functional connectivity (z-value > 1.96) in at least 3/6 hemispheres (F99 overlap) are shown on the left and the corresponding mean functional connectivity (F99 average) is shown on the right, overlaid in both cases on an inflated and flattened representation of the right cortical hemisphere of monkey F99. (A) Ipsilateral connectivity: mean z-values of the left pmCSv within left hemisphere and right pmCSv within right hemisphere. (B) Contralateral connectivity: mean z-values of the left pmCSv with right hemisphere and right pmCSv with left hemisphere. Black dots indicate the local maxima of the responses to egomotion-consistent optic flow stimuli (see Figure 1), with the location of pmCSv signaled by continuous or dotted black circles for the ipsilateral and contralateral pmCSv, respectively. White dotted lines show the delineation of the main sulci.
