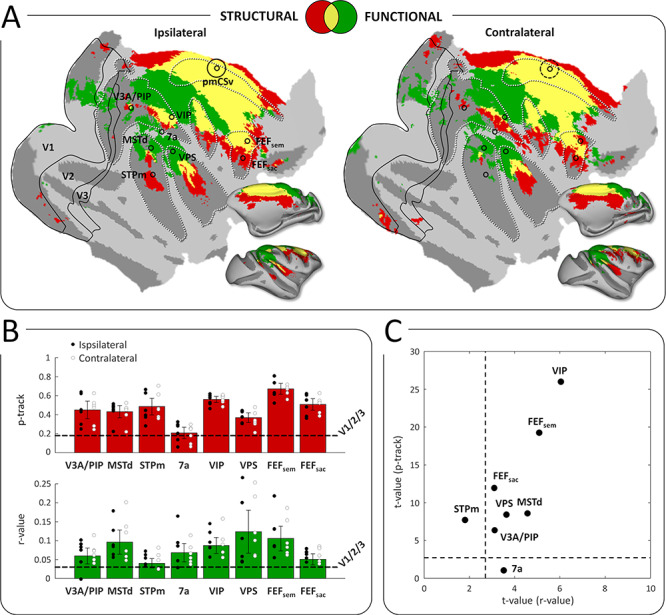
Figure 6.

Conjunction of functional and structural connectivity. (A) Overall maps of pmCSv connectivity, with structural connectivity only (in red), functional connectivity only (in green), or both types of connectivity (in yellow), projected on flattened and inflated representations of the right cortical hemisphere of monkey F99. Maps of ipsilateral and contralateral connectivity are shown on the left and right sides, respectively. Regions that are specifically activated by egomotion-consistent optic flow are indicated: V3A/PIP, MSTd, STPm, 7a, VIP, VPS, FEFsem, FEFsac (Figure 1). Borders of the visual areas V1, V2, and V3 are shown as black lines. Black circles indicate the local maxima of the responses to egomotion-consistent optic flow stimuli (Figure 1), with the location of pmCSv signaled by continuous or dotted black circles for the ipsilateral and contralateral pmCSv, respectively. White dotted lines show the delineation of the main sulci. (B) Bar graphs of pmCSv mean structural (track probabilities; in red) and functional (correlation coefficients; in green) connectivity (with 95% confidence intervals) with each of the target areas marked in (A). The horizontal dashed lines represent the average results of V1/V2/V3 for statistical comparison. Individual results are shown as black and white dots for ipsilateral and contralateral connectivity respectively. (C) Scatterplot showing the strength of the structural and functional connectivity for all the target areas relative to the mean connectivity of V1/V2/V3, expressed as t-values. The dotted lines indicate the threshold of statistical significance (t-value>2.6; P < 0.05).
