. 2020 Oct 3;31(2):933–948. doi: 10.1093/cercor/bhaa266
© The Author(s) 2020. Published by Oxford University Press. All rights reserved. For permissions, please e-mail: journals.permissions@oup.com
This article is published and distributed under the terms of the Oxford University Press, Standard Journals Publication Model (https://academic.oup.com/journals/pages/open_access/funder_policies/chorus/standard_publication_model)
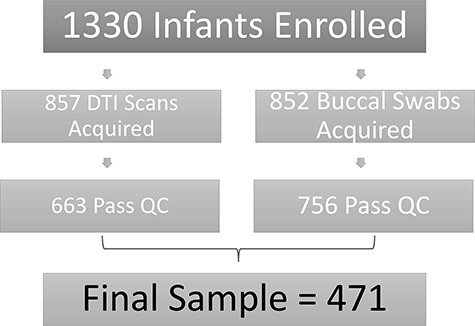
Figure 1 .

Flow chart showing data loss across the course of the study.
