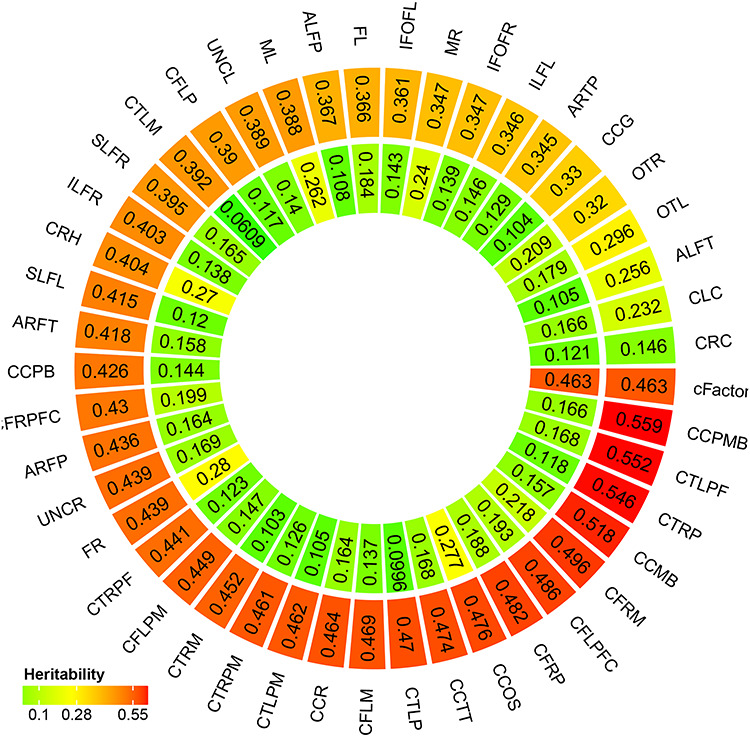
Figure 4 .

A latent measure of white matter microstructure accounts for a substantial proportion of heritable variation in individual tracts. Outer circle represents average heritability of each white matter tract. Inner circle represents proportion of genetic variation of each tract after subtracting the first tractography factor to the total variation. An explanation of these abbreviations can be found in Supplementary Table 6.
