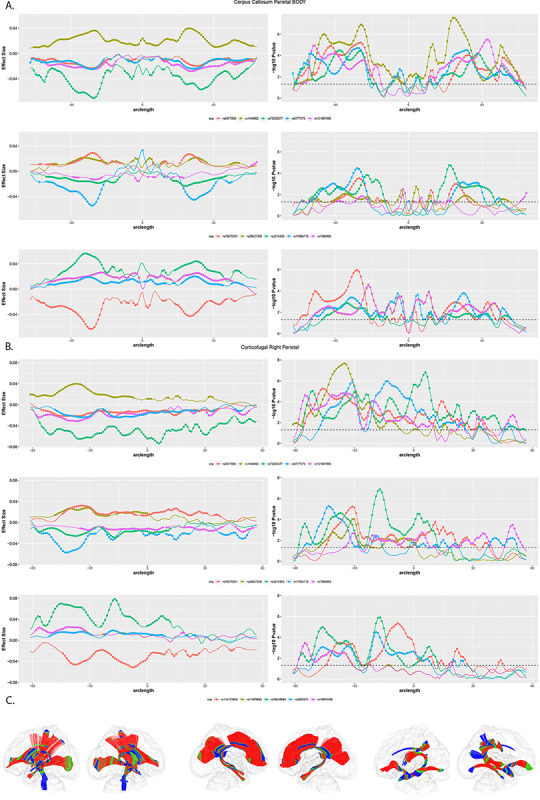
Figure 9 .

LD-independent SNPs with p-values smaller than 5 x 10⁻⁶ show significant associations with FA along multiple fiber tracts. Panel A. Local test statistics along the segment of the corpus callosum that connects left and right parietal cortex. Left side depicts effect size (Beta); right side depicts –log10 p-values. Circles represent significant associations. Note the drop in effect size and significance in the central portion of the tract. Panel B. Local test statistics along the corticofugal tract originating in right parietal cortex. Left side depicts effect size (Beta); right side depicts –log10 p-values. Circles represent significant associations. Note the drop in effect size and significance in the inferior portions of this tract. Panel C. 3D representations of major fiber tracts within a glass brain: projection tracts (left) commissural (middle), and association (right) tracts. Color represents –log10 p values for rs6077860, the intronic SNP in PSMF1. Red indicates low (more significant) p-values, blue represents high p-values.
