Figure 2.

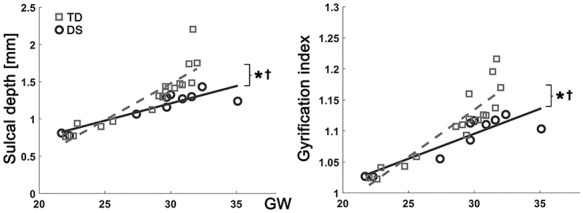
Growth trajectories of whole brain average sulcal depth and GI. x-axis indicates GW, and y-axis indicates observed values of sulcal depth (mm) and GI. *Significant group difference and †significant group-GW interaction effect.

Growth trajectories of whole brain average sulcal depth and GI. x-axis indicates GW, and y-axis indicates observed values of sulcal depth (mm) and GI. *Significant group difference and †significant group-GW interaction effect.