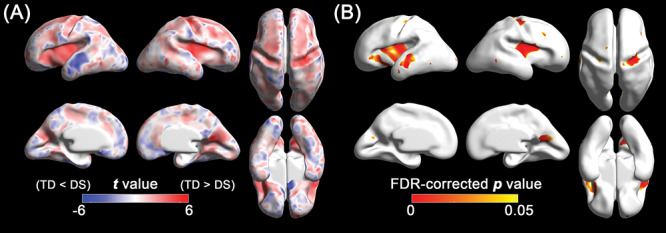
Figure 3.

Statistical results of the vertex-wise comparison in sulcal depth between DS and TD fetuses using the linear mixed models. (A) Statistical t map. Red indicates sulcal depth in fetuses with DS is shallower than TD fetuses, and blue indicates sulcal depth in fetuses with DS is deeper than TD fetuses. (B) FDR-corrected p map. Red represents regions showing statistically different sulcal depth between DS and TD groups (FDR-corrected P < 0.05).
