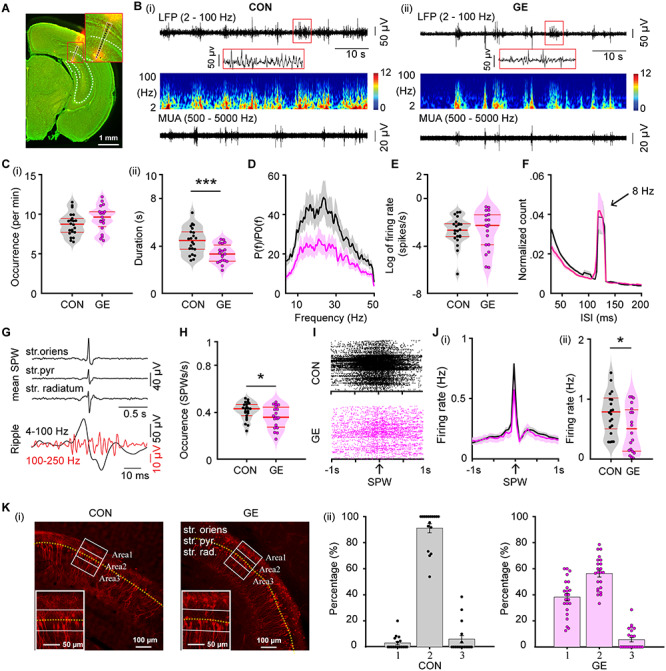
Figure 1.

Patterns of network activity and neuronal firing in the CA1 area of i/vHP from neonatal GE mice. (A) Digital photomontage reconstructing the location of the Dil-labeled 1 × 16-site recording electrode (orange) in a 100 μm-thick coronal section containing the CA1 from a P9 mouse. Inset, the position of recording sites (black dots) over the pyramidal layers displayed at higher magnification. (B) Extracellular LFP recordings of discontinuous oscillatory activity in the CA1 area from a P9 CON (i) and a P9 GE (ii) mouse displayed after bandpass (2–100 Hz) filtering (top) and the corresponding MUA after bandpass (500–5000 Hz) filtering (bottom). Traces are accompanied by the color-coded wavelet spectra of the LFP at identical time scale. (C) Violin plots displaying the occurrence (i) and the duration (ii) of hippocampal oscillatory activity recorded in CON and GE mice. (D) Averaged power spectra P(f) of discontinuous oscillatory activity normalized to the baseline power P0(f) of time windows lacking oscillatory activity in CON (black) and GE (red) mice. (E) Violin plots displaying the firing activity of CA1 neurons in CON and GE mice. (F) Histograms of ISI for CON (black) and GE (red) mice. Note the prominent ISI peak at ~125 ms interval, which corresponds to ~8 Hz. (G) Characteristic SPWs and ripple events recorded in the CA1 area. (H) Violin plots displaying the occurrence of SPWs in CON and GE mice. (I) Examples of spike trains from CA1 neurons aligned to SPWs in CON and GE mice. (J) Histograms of spiking activity aligned to SPWs (i) and violin plots displaying peak firing rate at SPWs (ii) in CON (black) and GE (red) mice. (K) (i) Photomicrographs depicting tDimer2-expressing pyramidal neurons (red dots) in the CA1 area of a P9 CON mouse and a P9 GE mouse. The yellow dotted line indicates the pyramidal layer of CA1. The three white blocks with width of 80 μm and length of 200 μm centered on the pyramidal layers correspond to the regions of interest for the quantification of tDimer-transfected neurons. Inset, the tDimer2-expressing cells over the pyramidal layers displayed at higher magnification. (ii) Bar diagram of the distribution of the tDimer-transfected neurons in the three blocks defined in (i) in CON and GE mice. Single data points are represented as dots. Single data points are represented as dots and the red horizontal bars in violin plots correspond to the median and the 25th and 75th percentiles. *P < 0.05, ***P < 0.001.
