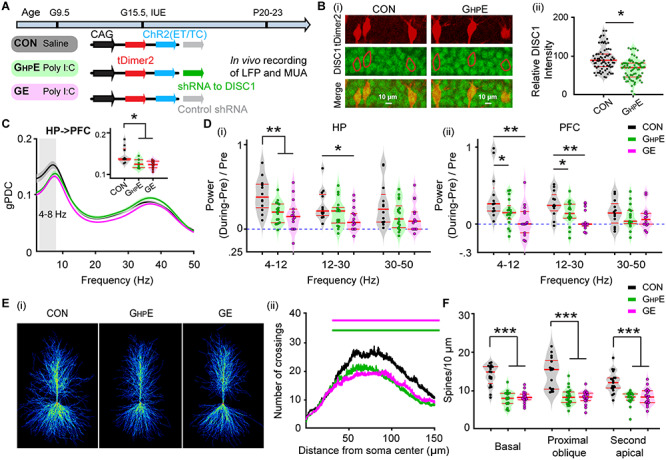
Figure 2.

Patterns of network activity and neuronal firing in HP and PFC from neonatal immune challenged mice with HP-confined DISC1 suppression. (A) Timeline of experimental protocol and description of the three investigated groups of mice: CON mice, immune-challenged mice with suppression of DISC1 confined to HP (GHPE), and immune-challenged mice with brain-wide DISC1 knock-down (GE). For each group the constructs used for IUE to target hippocampal CA1 pyramidal neurons is specified. (B) Photomicrographs depicting tDimer2-expressing pyramidal neurons (red) in the CA1 area when stained for NeuN (green) from a P9 mouse. Inset, photograph displaying the tDimer2-expressing cells at a higher magnification. (C) (i) Photographs displaying the DISC1 immunoreactivity (green) in relationship with the tDimer2-expression (red) in the CA1 area of i/vHP from P9 GHPE and CON mice. (ii) Violin plots displaying the relative DISC1 immunoreactivity averaged for GHPE and CON mice at P8-P10. (D) Violin plots displaying the occurrence (i) and the duration (ii) of hippocampal oscillatory activity recorded in CON, GHPE and GE mice. (E) Averaged power spectra P(f) of discontinuous oscillatory activity normalized to the baseline power P0(f) of time windows lacking oscillatory activity in CON (black), GHPE (green), and GE (magenta) mice. Insert, violin plots displaying the relative power averaged for 4–50 Hz in CON, GHPE, and GE mice. (F) Violin plots displaying the occurrence of SPWs in the CA1 area of CON, GHPE, and GE mice. (G) Histograms of spiking activity aligned to SPWs (i) and violin plots displaying the peak SPW-related firing in CON (black), GHPE (green), and GE (magenta) mice (ii). (H) Left, digital photomontage reconstructing the location of the Dil-labeled 4 × 4-site recording electrode (orange) in a 100 μm-thick coronal section containing the PFC from a P9 mouse. Right, the position of recording sites (white dots) over the prelimbic layers displayed at higher magnification. (I) Violin plots displaying the occurrence (i) and the duration (ii) of prefrontal oscillatory activity recorded in CON, GHPE, and GE mice. (J) Averaged power spectra P(f) of discontinuous oscillatory activity normalized to the baseline power P0(f) of time windows lacking oscillatory activity in CON (black), GHPE (green), and GE (magenta) mice. Inset, violin plots displaying the relative power averaged for 4–50 Hz in CON, GHPE and GE mice. (K) Violin plots displaying the neuronal firing in prefrontal layer 2/3 and layer 5/6 of CON, GHPE, and GE mice. Each dot stands for one slice (3–4 slices per mouse). (L) Line plots of mean PLV for oscillatory activity simultaneously recorded in PFC and HP of in CON (black), GHPE (green), and GE (magenta) mice. Inset, violin plots displaying the PLV when averaged for 4–30 Hz. (M) Line plots of mean gPDC in relationship to frequency for HP➜PFC in CON (black), GHPE (green), and GE (magenta) mice. Inset, violin plots displaying gPDC when averaged for 4–30 Hz in CON, GHPE, and GE mice. Single data points are represented as dots and the red horizontal bars in violin plots correspond to the median and the 25th and 75th percentiles. *P < 0.05, **P < 0.01, ***P < 0.001.
