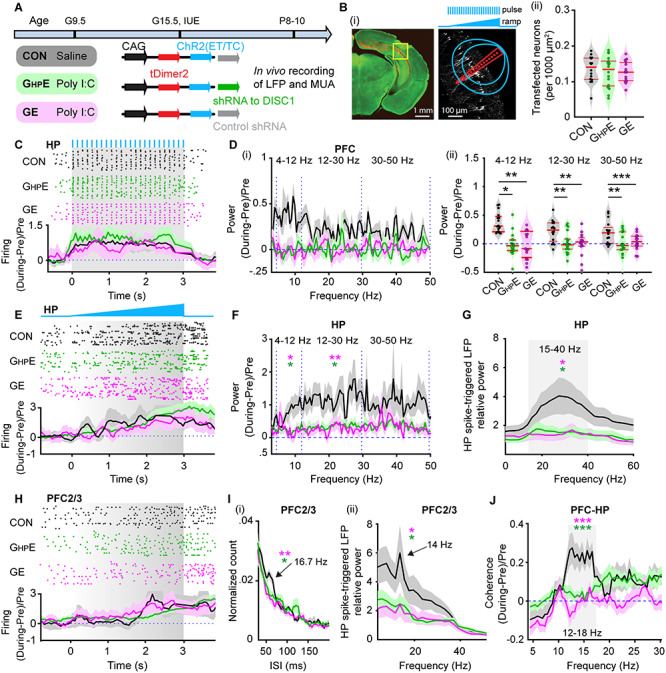
Figure 3.

Light-induced activation of i/vHP and prefrontal–hippocampal coupling in immune challenged mice with whole-brain and HP-confined DISC1 suppression. (A) Timeline of experimental protocol and description of the three investigated groups of mice: CON, GHPE, and GE. For each group, the constructs used for IUE to target hippocampal CA1 pyramidal neurons is specified. (B) (i) Left, ChR2(ET/TC)-tDimer2-expressing cells (red) in a 50 μm-thick Nissl-stained (green) coronal section including CA1 area from a P9 mouse. Right, recording sites together with transfected neurons (white dots). Green lines correspond to the iso-contour lines for light power of 1 and 10 mW/mm2, respectively. 3 s-long pulse (8 Hz) and ramp stimulation are applied to activate hippocampal pyramidal neurons. (ii) Violin plots displaying the number of transfected neurons within the iso-contour lines for light power of 1 mW/mm2. (C) Top, representative raster plot of hippocampal SUA in response to 8 Hz pulse stimulation (3 ms-long pulse, 473 nm) in the CA1 area of P9 CON, GHPE, and GE mice. Bottom, Histograms of hippocampal firing activity during 8 Hz pulse stimulation normalized to the activity before stimulation in CON (black), GHPE (blue), and GE (red) mice. (D) (i) Power of prefrontal oscillatory activity during pulse stimulation of CA1 pyramidal neurons normalized to the activity before stimulation in CON (black), GHPE (green), and GE (magenta) mice. (ii) Violin plots displaying the oscillatory power averaged for different frequency bands (4–12 Hz, 12–30 Hz, 30–50 Hz) in response to pulse stimulation for all investigated mice. (E) Top, representative raster plot of hippocampal spiking in response to ramp stimulation (3 s duration, 473 nm) in CON, GHPE, and GE mice. Bottom, Histograms of hippocampal firing activity during ramp stimulation normalized to the activity before stimulation in CON (black), GHPE (green), and GE (magenta) mice. (F) Power of hippocampal oscillatory activity during ramp stimulation of CA1 pyramidal neurons normalized to the activity before stimulation in CON (black), GHPE (green), and GE (magenta) mice. (G) Line plots of frequency-dependent relative power of spike-triggered LFP in HP of CON (black), GHPE (green), and GE (magenta) mice. (H) Top, representative raster plot of prefrontal spiking in response to ramp stimulation (3 s duration, 473 nm) in HP in one CON, GHPE, and GE mouse. Bottom, histograms of prefrontal firing activity during ramp stimulation normalized to the activity before stimulation in CON (black), GHPE (green), and GE (magenta) mice. (I) (i) Histograms of ISI for layer 2/3 prefrontal neurons during ramp stimulation of hippocampal CA1 pyramidal neurons for CON (black), GHPE (green), and GE (magenta) mice. Note the prominent ISI peak at ~16.7 Hz. (ii) Line plots of frequency-dependent relative power of hippocampal spike-triggered LFP in prefrontal layer 2/3 of CON (black), GHPE (green), and GE (magenta) mice. (J) Line plots of coherence between PFC and HP during ramp stimulation of hippocampal CA1 pyramidal neurons normalized to coherence values before stimulation. Single data points are represented as dots and the red horizontal bars in violin plots correspond to the median and the 25th and 75th percentiles. *P < 0.05, **P < 0.01, ***P < 0.001. Magenta stars correspond to the comparison between GE and CON mice. Green stars correspond to the comparison between GHPE and CON mice.
