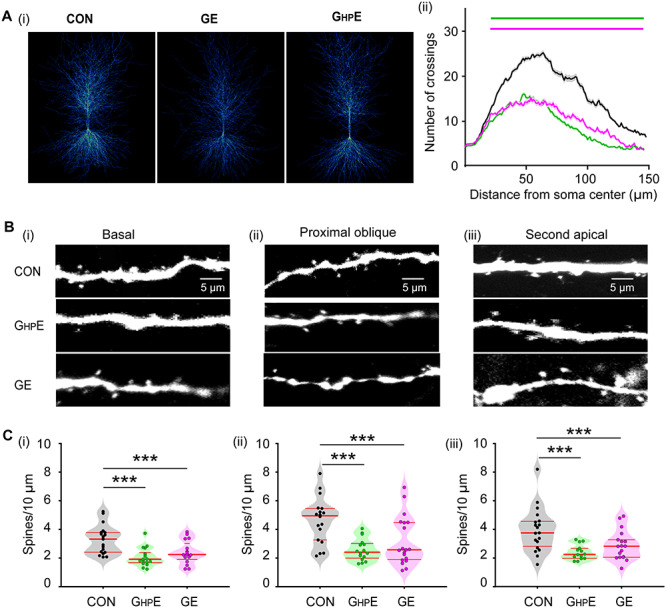
Figure 4.

Morphology of hippocampal pyramidal neurons in neonatal GHPE and GE mice. (A) (i) Heatmap displaying an overlay of all traced dendrites of transfected CA1 pyramidal neurons in CON, GHPE, and GE mice. (ii) Graph displaying the average number of dendritic intersections within a 150 μm radius from the soma center of CA1 pyramidal neurons in CON (black, n = 21 neurons from three mice), GHPE (blue, n = 21 neurons from three mice) and GE (red, n = 21 neurons from three mice) mice. Green and magenta bars indicate significant difference (***P < 0.001) between CON and GHPE mice and between CON and GE mice, respectively. (B) Photograph displaying representative basal (i), proximal oblique (ii) and second apical dendrites (iii) of CA1 pyramidal neurons from a P9 CON, a P9 GHPE, and a P9 GE mouse. (C) Violin plots displaying the spine density on basal (i), proximal oblique (ii), and second apical dendrites (iii) of CA1 pyramidal neurons from CON (20 neurons from three mice), GHPE (20 neurons from three mice), and GE (21 neurons from three mice) mice. Single data points are represented as dots and the red horizontal bars in violin plots correspond to the median and the 25th and 75th percentiles. ***P < 0.001.
