Figure 6.

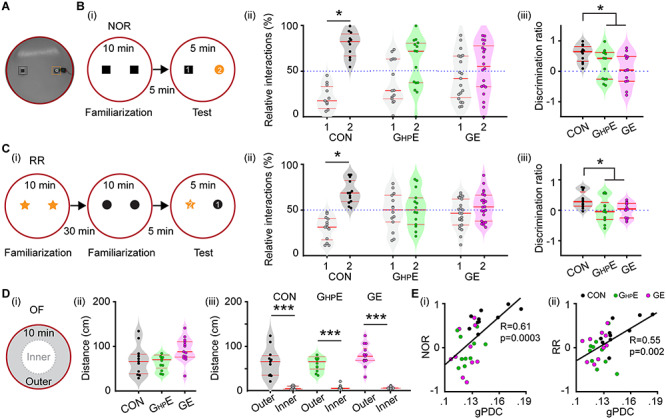
Novelty recognition of immune challenged mice with whole-brain and HP-confined DISC1 suppression. (A) Photograph of the arena used for NOR and RR tasks. (B) (i) Schematic diagrams of the protocol for NOR task. (ii) Violin plots displaying the relative interaction time spent by CON, GHPE, and GE mice with the objects during the NOR test trial. The dotted line indicates chance level. (iii) Violin plots displaying the NOR discrimination ratio when averaged for CON, GHPE and GE mice. (C) (i) Schematic diagrams of the protocol for RR task. (ii) Violin plots displaying the relative interaction time spent by CON, GHPE, and GE mice with the objects during the RR test trial. The dotted line indicates chance level. (iii) Violin plots displaying the RR discrimination ratio when averaged for CON, GHPE, and GE mice. (D) (i) Schematic diagrams of the protocol for OF task. (ii) Violin plots displaying the distance covered in 10 min by CON, GHPE, and GE mice during the OF task. (iii) Violin plots displaying the distance covered in the outer circle and the inner circle by CON, GHPE, and GE mice during OF task. (E) (i) The Pearson’s correlation between gPDC and discrimination ratio in NOR task. (ii) Same as (i) for Pearson’s correlation between gPDC and RR. Single data points are represented as dots and the red horizontal bars in violin plots represent the median and the 25th and 75th percentiles. *P < 0.05, ***P < 0.001.
