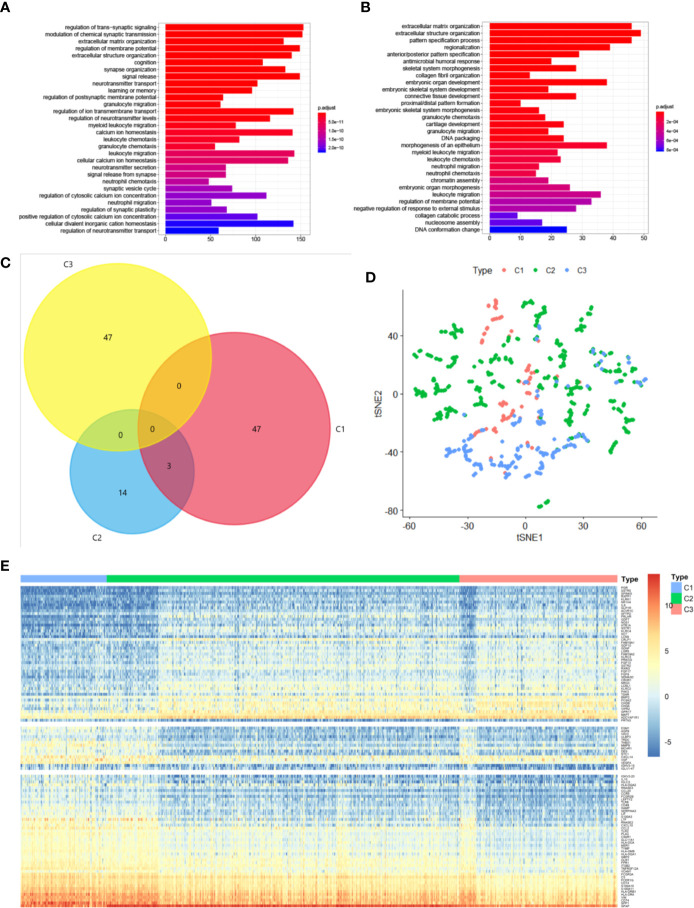
Figure 2.
Subtype-specific genes and signaling pathways in diffuse glioma. (A, B) KEGG analysis of differentially expressed genes in subtypes C1 (A) and C3 (B). The size and color of the dots represent the number of genes and the range of P values, respectively. (C) A Venn diagram depicting overlapping immune-gene sets among the three subtypes. (D) t-SNE analysis showing the stratification based on the expression profile of subtype-specific genes in TCGA cohort. (E) The expression profile of 109 subtype-specific genes.

