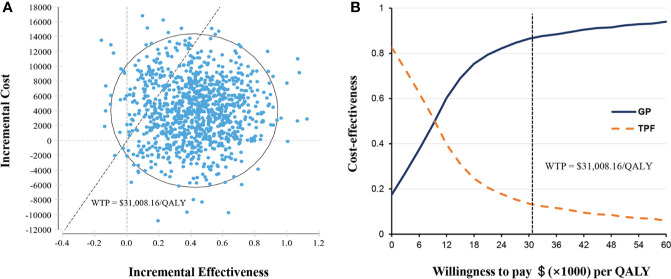
Figure 3.
Probabilistic sensitivity analysis. (A) Incremental cost-effectiveness scatterplot of 10,000 Monte Carlo simulations shows high probability of cost-effectiveness. (B) Cost-effectiveness acceptability curves revealed the results of probabilistic sensitivity analysis under different thresholds of WTP. The dashed line represents the WTP threshold $31,008.16 per QALY. GP, gemcitabine and cisplatin; QALY, quality-adjusted life-years; TFP, docetaxel and cisplatin plus fluorouracil; WTP, willingness-to-pay.

