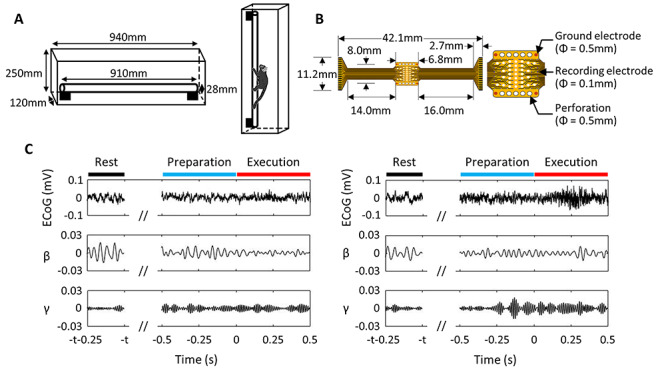
Figure 1.

Experimental setup. (A) Schema of the cage used for horizontal and vertical locomotion tasks. The animals moved over a 28-mm diameter substrate made of an 18-mm diameter wooden pole covered with a 5-mm-thick urethane sheet. (B) 64-channel electrocorticographic (ECoG) array (left) and zoom-in of the recording area (right), adapted from Tia et al. (2017) Creative Commons permission © 2017 by John Wiley & Sons Ltd (C) Typical ECoG signal recorded from a channel in premotor area 6Dc of MK1. Left panels represent horizontal condition and right panels, vertical condition. Top panels represent the raw signal; second and third panels represent β (16–35 Hz) and γ (75–100 Hz) components obtained after band-pass filtering. Data is aligned with respect to movement onset (time = 0). Rest was recorded ≥1 s before movement onset. Duration separating rest from movement onset is designated as t.
