
Figure 4.
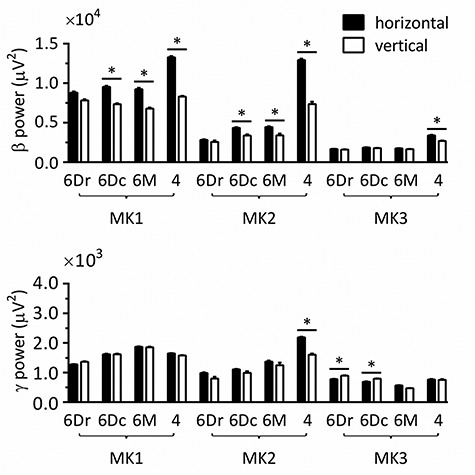
Spectral power in β and γ bands at rest. Pairwise comparisons were performed by Wilcoxon rank-sum test with Bonferroni–Holm correction, after three-way ANOVAs with aligned rank transform (factors: monkey, task, and cortical area). 6Dr, 6Dc, 6M, and 4 refer to the corresponding Brodmann areas. All measurements are expressed as mean ± standard error of the mean (SEM). *P < 0.05, by Wilcoxon pairwise comparison with Bonferroni–Holm correction.