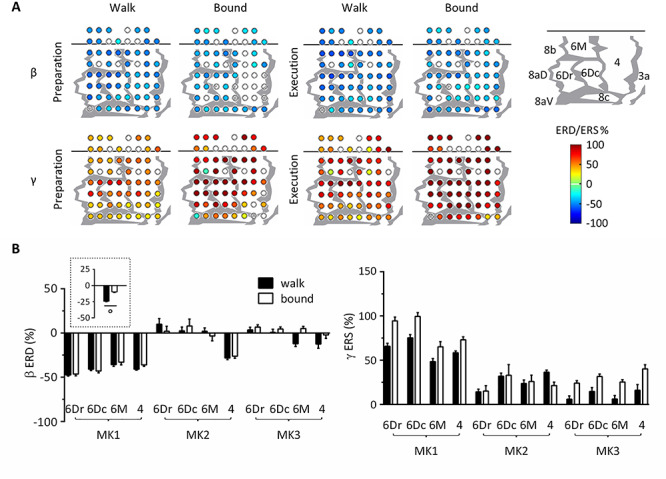
Figure 7.

Gait-related modulation of β and γ power, considering vertical task only. (A) ERD/ERS in β and γ bands over the sensorimotor cortex of MK1. Differences from baseline resting power were statistically assessed by the bootstrap method (P < 0.05). Electrodes with statistically significant ERD/ERS were represented as filled colored circles, whereas those with nonsignificant ERD/ERS were represented as open circles. Blue colors denote ERD and red colors denote ERS, ranging from −100% to 100%. Bad channels were excluded from analysis and were not represented. Gray lines indicate architectonic borders between cortical areas, reconstructed from histological assessment. The cortical map of MK1 is represented in the upper right corner. (B) ERD/ERS in β and γ bands across monkeys, areas and gaits. Preparation and execution epochs were merged in the main plots since ANOVAs with aligned rank transform (factors: monkey, gait, epoch, and cortical area) found no significant main effect nor interaction with epoch. The plot surrounded by a dot line emphasizes gait-related differences in β ERD averaged across monkeys, epochs, and cortical areas. All measurements are expressed as mean ± SEM. °P < 0.001, main effect of gait. 6Dr, 6Dc, 6M, and 4 refer to the corresponding Brodmann areas.
