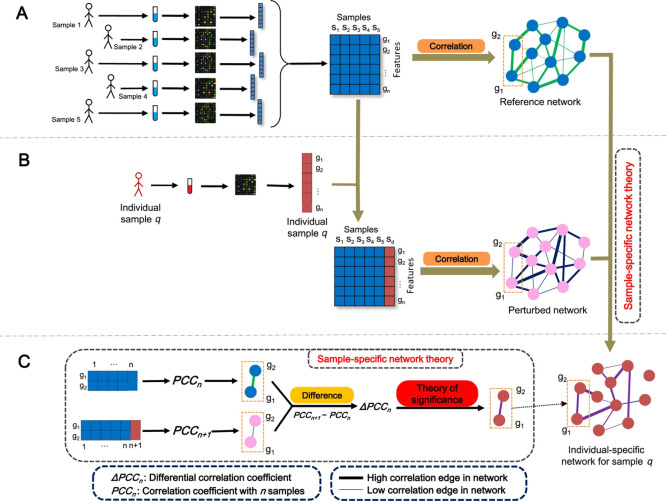
Figure 2.
Visual illustration of the ssPCC estimation of single sample network. (A) For a group of n reference samples, a reference network PCCn can be constructed using Pearson’s correlations. (B) A new sample q is added and the perturbed network PCCn+1 with this additional sample is calculated. The difference between PCCn and PCCn+1 is due to sample q. (C) Differential network ΔPCCn is constructed taking the difference between perturbed and the reference network PCCnn + 1 – PCCn. Figure reproduced and adapted from the original publication,13 published under Creative Commons license CC BY-NC-ND.

