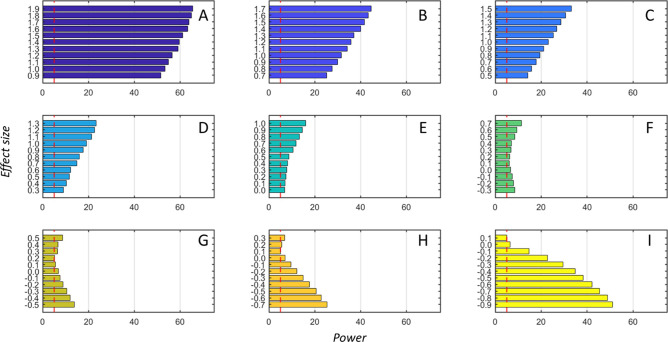
Figure 3.
Actual power of the ssPCC proposed testing procedure based on a Z-test (see the section ssPCC: Single Sample Network Based on Pearson’s Correlation and eq 12) as a function of the effect size defined in the section Power of the ssPCC Test using the Simulation Scheme 1. The nine panels (A–I) correspond to the different correlation ρ0 of the ssPCC reference network (PCCn, see eq 14): the values are −0.9, −0.7, −0.5, −0.3, 0, 0.3, 0.5, 0.7, and 0.9, respectively. For each value of ρ0, we let ρq (see eq 16) to vary in the range [0:1] with increments of 0.1. The effect size is defined as ρq – ρ0, so that for each ρ0 there are 11 effect size values, indicated on the y-axis of the bar plots. Results are shown for sample size n = 1. The actual power is calculated over 1000 tests. The vertical dashed red lines indicate the 5% level.

