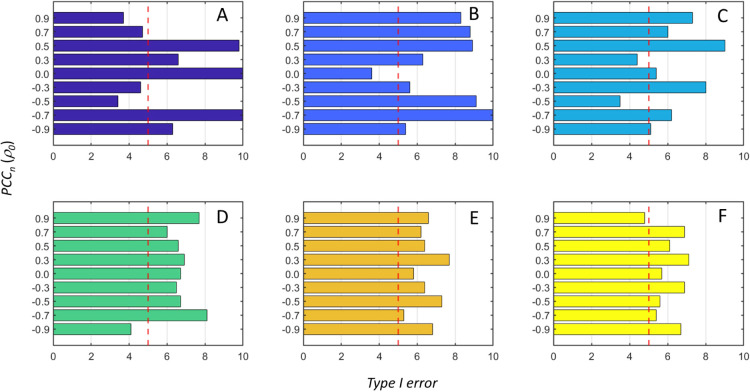
Figure 4.
Actual Type I error (α) of the ssPCC proposed testing procedure based on a Z-test (see the section ssPCC: Single Sample Network Based on Pearson’s Correlation and eq 12) as a function of the effect size defined in the section Power of the ssPCC Test. The nominal 5% level is indicated by the vertical dashed red line. The six panels (A–F) correspond to the different sample sizes used, which are 10, 50, 100, 500, 1000, and 10,000, respectively. The actual α is calculated over 1000 tests.

