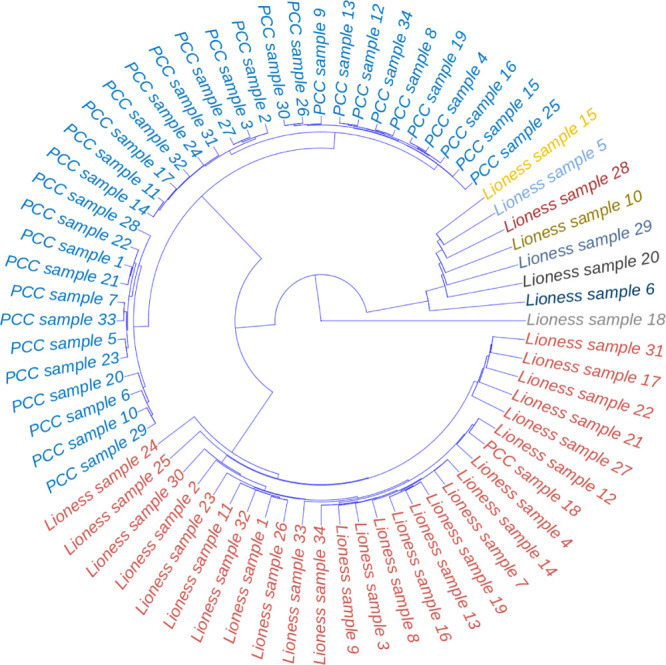
Figure 8.

Clustering dendrogram of the single sample networks for the metabolomics study case. The single samples for the subjects affected by NSTIs are shown. Samples are color-coded by distance/similarity: red, for LIONESS (using LIONESS-S implementation) and blue for ssPCC single sample networks. Distances are calculated on the vectorized networks.
