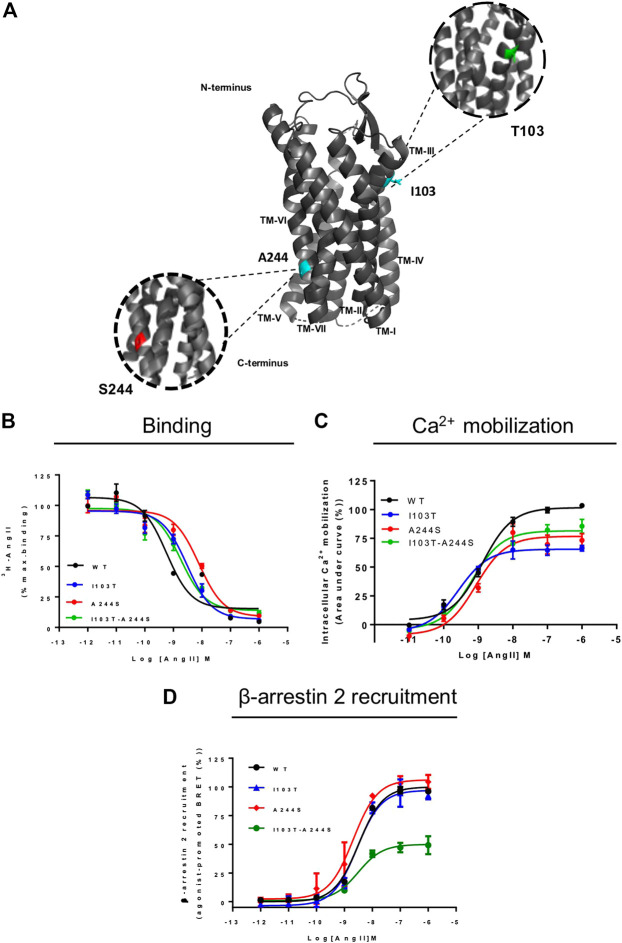
FIGURE 1.
Position of the mutations correlated with atrial fibrillation and comparative analyses of signal profile between AT1 and mutant receptors. (A) Schematic representation of position of mutations in AT1 receptor. TM, transmembrane; cyan, original amino acids residues, Isoleucine and Alanine; green, Threonine substitution; red, Serine substitution. (B) Competition binding profiles for AngII against [3H]-AngII in HEK293T cells transiently expressing the AT1R and mutants. Data are expressed as percentages of the maximum specific binding of the radioligand. (C) Dose-response curve of the Ca2+ mobilization assay after AngII stimulation. Data are expressed as percentages of the maximum Ca2+ mobilization promoted by AT1R. (D) BRET assays showed that in the presence of AngII, AT1R and mutants promote β-arrestin 2 recruitment. Data are expressed as percentages related to the maximal recruitment promoted the AT1R. All data were generated from at least three independent experiments.

