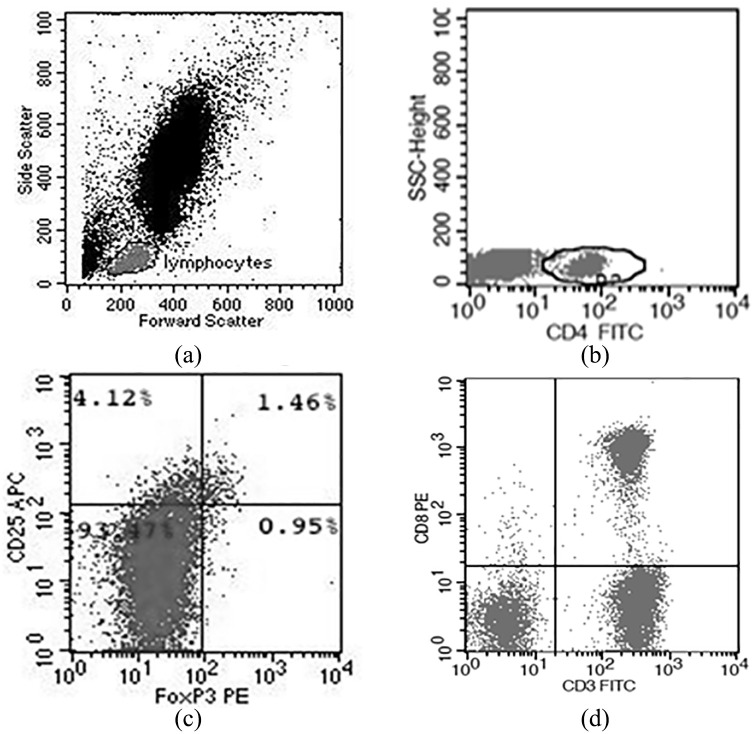
Figure 1.
Flow cytometric analysis. (a) Using typical forward and side scatter characteristics, a gate was first set on lymphocytes. (b) From the lymphocyte gate, percent CD4+ T cells were determined. (c) From the CD4+ gate, the percent CD25+ FoxP3+ CD4+ Tregs are shown. (d) From the lymphocyte gate, percent CD3+ CD8+ T cells are shown.

