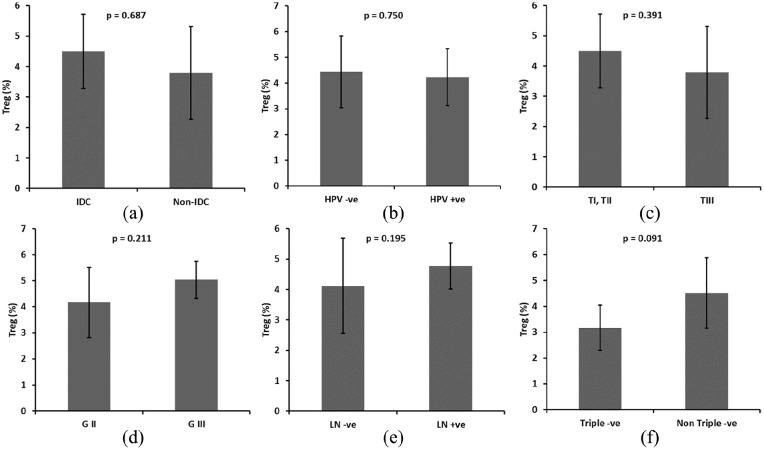
Figure 2.
Relation between the frequency of CD25+ FOXP3+ CD4+ Tregs in (a) HPV positive (+ve) versus HPV negative (−ve). (b) IDC vs. non-IDC. (c) Small tumor size (TI, TII) versus large tumors (TIII). (d) Well differentiated (G2) versus poorly differentiated (G3). (e) Node negative patients versus node positive patients. (f) Triple −ve versus non-triple −ve patients. Groups were compared using t tests (a, b, c, e, f) and ANOVA (d). Bars represent standard deviation.

