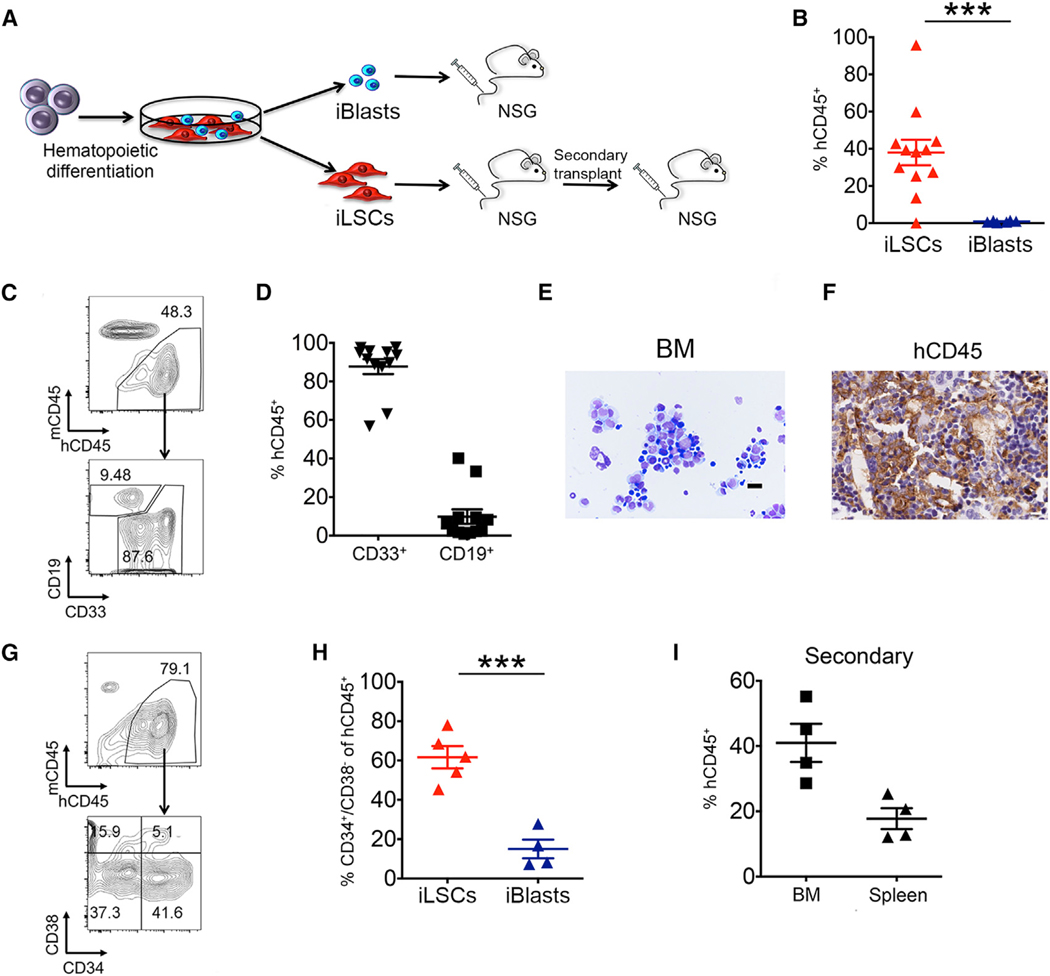
Figure 2. The iLSC Fraction Contains the Engraftment Potential.

(A) Scheme of transplantation experiments. AML-4.10 and AML-4.24 iPSCs were differentiated along the hematopoietic lineage for 12–14 days and plated on tissue-culture-treated plates. iLSCs and iBlasts were manually separated 2 days later and intravenously injected into sublethally irradiated or busulfan-treated NSG mice. BM cells from mice injected with iLSCs were isolated and transplanted into secondary recipients.
(B) Levels of human engraftment in the BM of mice 8–12 weeks after transplantation. Each data point represents a unique mouse. The mean and SEM from 3 independent transplantation experiments, 2 with iPSC line AML-4.10 and 1 with AML-4.24, are shown. ***p < 0.001, t test.
(C) Representative flow cytometry panels showing human cell engraftment and lineage markers CD33 (myeloid) and CD19 (lymphoid) in the BM of recipient mice 8–12 weeks post-transplantation with iLSCs.
(D) Fraction of myeloid (CD33+) and lymphoid (CD19+) lineage cells within the hCD45+ population in the BM of mice transplanted with iLSCs. Each data point represents a unique mouse. Mean and SEM from 3 independent transplantation experiments are shown.
(E) Wright-Giemsa-stained cytospin of BM cells of a recipient mouse transplanted with iLSCs. Scale bar, 100 μm.
(F) Human CD45 detection by immunohistochemistry in the BM of a recipient mouse transplanted with iLSCs. Scale bar, 5 μm.
(G) Representative flow cytometry panels showing human cell engraftment and human phenotypic LSCs in the BM of recipient mice 8–12 weeks post-transplantation.
(H) Fraction of CD34+/CD38− cells within the hCD45+ population in the BM of mice injected with iLSCs or iBlasts. Each data point represents a unique mouse. Mean and SEM are shown. ***p < 0.001, t test.
(I) Human engraftment levels in the BM and spleen of secondary recipient mice. Each data point represents a unique mouse. Mean and SEM are shown. See also Figure S2.
