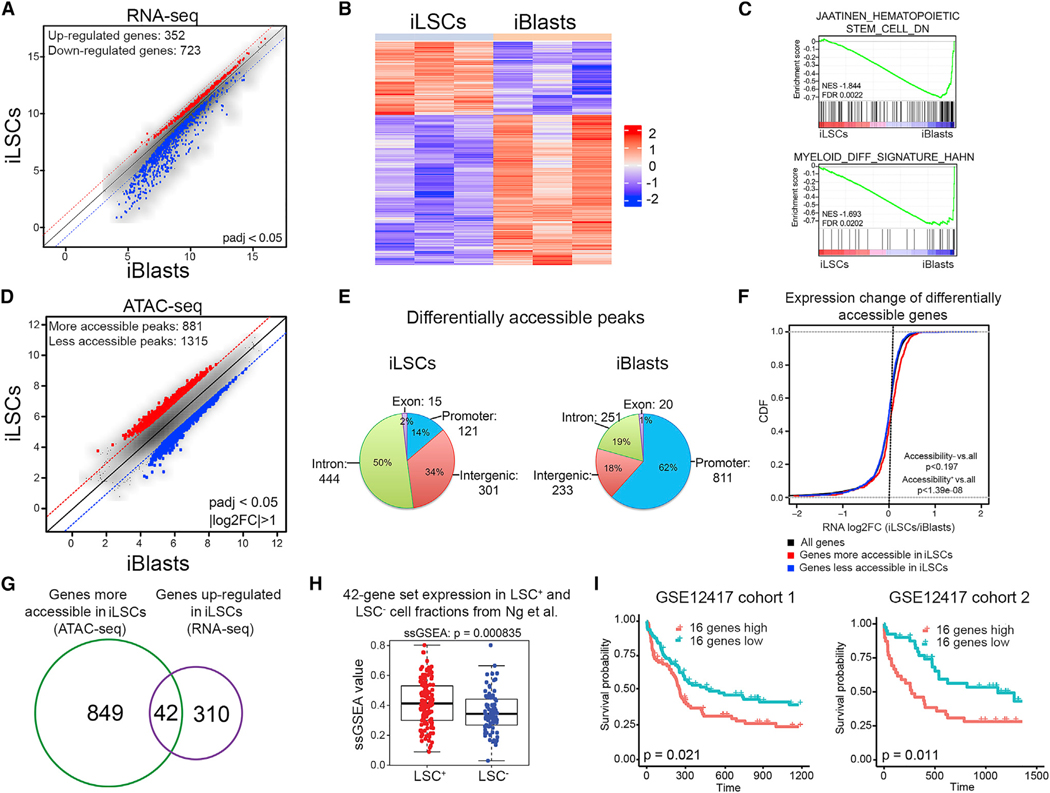
Figure 5. Extraction of a Human LSC Gene Set through Integrated Genomics Analyses.

(A) Scatterplot of the average log2-normalized counts of differentially expressed genes in iLSCs compared to iBlasts. Genes with adjusted p < 0.05 were considered significantly differentially expressed.
(B) Row-normalized heatmap of differentially expressed genes between iLSCs and iBlasts.
(C) GSEA plots of the indicated gene sets against the rank list of differentially expressed genes between iLSCs and iBlasts. Enrichment for genes downregulated in HSCs (top) and for myeloid differentiation genes (bottom) in iBlasts compared to iLSCs indicates loss of HSC gene expression and gain of myeloid differentiation gene expression in iBlasts.
(D) Scatterplot of the average log2-normalized counts of differentially accessible peaks in iLSCs compared to iBlasts. Peaks with log2 fold change of >1 or log2 fold change of <—1 and Benjamini & Hochberg (BH)-adjusted p < 0.05 were considered significantly differentially accessible.
(E) Genomic distribution of differentially accessible peaks that are more accessible in iLSCs (left) or more accessible in iBlasts (right). Absolute numbers and percentages are shown.
(F) Cumulative distribution functions (CDFs) of the expression change (log2 fold change [log2FC]) for all genes (black), genes significantly more accessible in iLSCs (red) and genes significantly more accessible in iBlasts (blue). Genes more accessible in iLSCs are also upregulated in iLSCs (Kolmogorov-Smirnov [KS] test, p < 1.39e-08). Genes more accessible in iBlasts are not differentially expressed between iLSCs and iBlasts compared to background (KS test, p < 0.197).
(G) Venn diagram showing the overlap between differentially accessible genes (green) and differentially expressed genes (purple) in iLSCs compared to iBlasts.
(H) Single-sample GSEA (ssGSEA) score of the 42 genes from (G) in LSC+ and LSC− fractions from primary AML patient cells from Ng et al. (2016) (GEO: GSE76008), showing significant association with LSC+ status (Wilcoxon rank-sum test, p < 8.35e-4).
(I) Kaplan-Meier estimates of overall survival in two patient cohorts, as indicated, based on expression of the 16-gene ssGSEA score, showing negative association with patient survival in both cohorts. See also Figure S5 and Table S3.
